Appendix D: Table D
Table D: Critical Values for the Distribution of Chi-Square (x2)
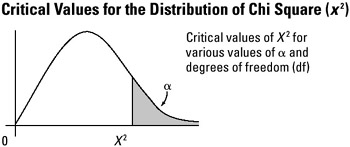
How to use this table: The top row of the chi-square critical values table lists the most common levels of significance. The column of figures on the left indicates the degrees of freedom.
For the chi-square statistic: df = (r − 1) (c − 1)
where r and c represent the number of rows and columns, respectively, in the contingency table.
Example: Suppose a researcher is using a 3 3 contingency table and is testing the null hypothesis of independence at the .01 level of significance. Using the formula above, degrees of freedom for a 3 3 table equal 4. Turn to page 620 and locate 4 in the df column. Move 5 columns to the right of 4 df and the critical value is 13.277. Therefore, if the researcher's chi-square statistic were equal to or greater than the critical value of 13.277, the null hypothesis of independence would be rejected at the .01 level of significance, and the alternative hypothesis would be supported.
For the goodness-of-fit statistic: df = K − 1
where K represents the number of attributes (cells) that comprise the variable of interest.
Example: Suppose a researcher is interested in studying the frequency of occurrence of accidents that occur on an hourly basis during an 8-hour shift. Using the formula above, degrees of freedom for a variable comprised of 8 attributes would be equal to 7, that is, (K − 1 = 8 − 1 = 7). If the researcher were testing the null hypothesis of no significant difference between observed and expected frequencies at the .10 level of significance, the critical value would be 12.017. Turn to page 620 and locate 7 in the df column. Move 2 columns to the right of 7 df and the critical value is 12.017. Therefore, if the researcher's chi-square statistic for this goodness-of-fit test were equal to or greater than the critical value of 12.017, the null hypothesis of no difference would be rejected at the .10 level of significance, and the alternative hypothesis would be supported.
| Note | For chi-square and goodness-of-fit tests, all tests of significance are essentially two-tailed tests. This is because all chi-square and goodness-of-fit tests are nondirectional. |
Critical Values for the Distribution of Chi Square (x2)
| df | Levels of significance | ||||||
|---|---|---|---|---|---|---|---|
| .20 | .10 | .05 | .025 | .01 | .005 | .001 | |
| 1 | 1.644 | 2.706 | 3.842 | 5.024 | 6.635 | 7.879 | 10.828 |
| 2 | 3.219 | 4.605 | 5.991 | 7.378 | 9.210 | 10.597 | 13.816 |
| 3 | 4.642 | 6.251 | 7.815 | 9.348 | 11.345 | 12.838 | 16.265 |
| 4 | 5.989 | 7.779 | 9.488 | 11.143 | 13.277 | 14.860 | 18.459 |
| 5 | 7.289 | 9.236 | 11.070 | 12.832 | 15.086 | 16.750 | 20.515 |
| 6 | 8.558 | 10.645 | 12.592 | 14.449 | 16.812 | 18.547 | 22.458 |
| 7 | 9.803 | 12.017 | 14.067 | 16.013 | 18.475 | 20.278 | 24.321 |
| 8 | 11.030 | 13.362 | 15.507 | 17.534 | 20.090 | 21.955 | 26.124 |
| 9 | 12.242 | 14.684 | 16.919 | 19.023 | 21.666 | 23.589 | 27.876 |
| 10 | 13.442 | 15.987 | 18.307 | 20.483 | 23.209 | 25.187 | 29.586 |
| 11 | 14.631 | 17.275 | 19.675 | 21.920 | 24.724 | 26.756 | 31.261 |
| 12 | 15.812 | 18.549 | 21.026 | 23.336 | 26.216 | 28.298 | 32.906 |
| 13 | 16.985 | 19.812 | 22.362 | 24.735 | 27.687 | 29.817 | 34.524 |
| 14 | 18.151 | 21.064 | 23.685 | 26.118 | 29.140 | 31.317 | 36.117 |
| 15 | 19.311 | 22.307 | 24.995 | 27.488 | 30.578 | 32.798 | 37.690 |
| 16 | 20.465 | 23.542 | 26.296 | 28,845 | 32.000 | 34.267 | 39.244 |
| 17 | 21.615 | 24.769 | 27.587 | 30.191 | 33.409 | 35.718 | 40.780 |
| 18 | 22.760 | 25.989 | 28.869 | 31,526 | 34.805 | 37.156 | 42.301 |
| 19 | 23.900 | 27.203 | 30.144 | 32.852 | 36.191 | 38.582 | 43.807 |
| 20 | 25.037 | 28.412 | 31.410 | 34.170 | 37.566 | 39.997 | 45.300 |
| 21 | 26.171 | 29.615 | 32.671 | 35.479 | 38.932 | 41.401 | 46.797 |
| 22 | 27.301 | 30.813 | 33.924 | 36.781 | 40.289 | 42.796 | 48.268 |
| 23 | 28.429 | 32.007 | 35.172 | 38.076 | 41.638 | 44.181 | 49.728 |
| 24 | 29.553 | 33.196 | 36.415 | 39.364 | 42.980 | 45.558 | 51.178 |
| 25 | 30.675 | 34.382 | 37.653 | 40.646 | 44.314 | 46.928 | 52.620 |
| 26 | 31.795 | 35.563 | 38.885 | 41.923 | 45.642 | 48.290 | 54.052 |
| 27 | 32.912 | 36.741 | 40.113 | 43.195 | 46.963 | 49.645 | 55.476 |
| 28 | 34.027 | 37.916 | 41.337 | 44.461 | 48.278 | 50.993 | 56.892 |
| 29 | 35.139 | 39.087 | 42.557 | 45.722 | 49.588 | 52.336 | 58.301 |
| 30 | 36.250 | 40.256 | 43.773 | 46.979 | 50.892 | 53.672 | 59.703 |
| Critical values computed by John Timko. Used by permission. | |||||||
EAN: 2147483647
Pages: 326