Tool 210: Value Analysis
| AKA | N/A |
| Classification | Analyzing/Trending (AT) |
Tool description
The value analysis technique analyzes the functionality of a product, states an estimated cost for each function, and demonstrates a function as compared with that of a competitor's. This technique, therefore, forces an assessment of the manufacturing processes, parts and materials, and design features of a product.
Typical application
-
To identify needed product improvements.
-
To lower product costs.
-
To prioritize product redesign activities.
Problem-solving phase
| → | Select and define problem or opportunity |
| → | Identify and analyze causes or potential change |
| → | Develop and plan possible solutions or change |
| → | Implement and evaluate solution or change |
| Measure and report solution or change results | |
| Recognize and reward team efforts |
Typically used by
| Research/statistics | |
| Creativity/innovation | |
| Engineering | |
| Project management | |
| Manufacturing | |
| 1 | Marketing/sales |
| Administration/documentation | |
| 2 | Servicing/support |
| 3 | Customer/quality metrics |
| 4 | Change management |
before
-
Linking Diagram
-
Factor Analysis
-
Customer Needs Table
-
Truth Table
-
Selection Window
after
-
Influence Diagram
-
Cost-Benefit Analysis
-
Activity Cost Matrix
-
Different Point of View
-
Idea Advocate
Notes and key points
-
The construction of the value analysis table may reflect a different set of factors.
-
The primary concern is to determine functions that have a high cost associated with them. These functions often call for a redesign priority.
-
Competitors' superior designs must be considered in all redesign efforts.
Step-by-step procedure
-
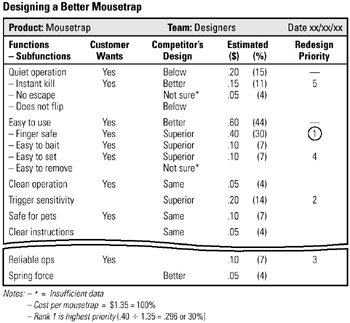
STEP 1 First, a customer satisfaction survey is completed to collect the customers "wants" or expectations. See example Designing a Better Mouse Trap.
-
STEP 2 As the second step, design engineering and manufacturing examine a number of competitors' products. The team checks for improved functionality, superior designs, and innovation.
-
STEP 3 A value analysis form is used to list the product's functions and subfunctions. Customer "wants" and competitor data are also filled in.
-
STEP 4 For every function and subfunction, the estimated cost and percent of total product cost are recorded.
-
STEP 5 The last step determines the functions that are strong candidates for redesign on the basis of cost and competitors' superior designs.
-
STEP 6 The completed value analysis form is reviewed, dated, and given to the process owners.
Example of tool application
Designing a Better Mousetrap
EAN: 2147483647
Pages: 326