Tool 201: Time Study Sheet
| AKA | N/A |
| Classification | Changing/Implementing (CI) |
Tool description
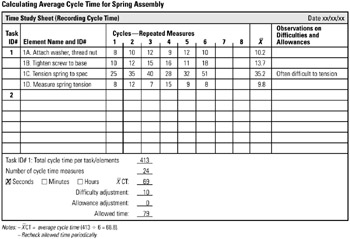
The time study sheet is a recording form that displays the cycle time used to complete a task on the first attempt, second attempt, and so on. It can potentially identify a trend or pattern caused by some process variation or change in the use of tools, layout, or sequence steps. The form is also used to show calculations such as average cycle time, various adjustments, and recommended time to be recorded as a standard.
Typical application
-
To establish criteria of performance.
-
To calculate average cycle times for performing tasks.
-
To collect cycle time data for constructing a cycle time flow chart.
Problem-solving phase
| → | Select and define problem or opportunity |
| → | Identify and analyze causes or potential change |
| Develop and plan possible solutions or change | |
| → | Implement and evaluate solution or change |
| → | Measure and report solution or change results |
| Recognize and reward team efforts |
Typically used by
| Research/statistics | |
| Creativity/innovation | |
| 2 | Engineering |
| 3 | Project management |
| 1 | Manufacturing |
| Marketing/sales | |
| Administration/documentation | |
| Servicing/support | |
| Customer/quality metrics | |
| 4 | Change management |
Notes and key points
-
Record cycle time in seconds, minutes, or hours.
-
Make adjustments for performing difficult task elements.
-
Make allowances for variations in working conditions.
before
-
Data Collection Strategy
-
Observation
-
Activity analysis
-
Checksheet
-
Task Analysis
after
-
Process Analysis
-
Problem Specification
-
Potential Problem Analysis (PPA)
-
Variance Analysis
-
Cycle Time Flow Chart
Step-by-step procedure
-
STEP 1 Identify the tasks and elements to be measured. List them on the time study sheet. See example Calculating Average Cycle Time for Spring Assembly.
-
STEP 2 Determine how often elements of the task are to be measured and take measurements. Record measurements and calculate average cycle time (
 CT).
CT). -
STEP 3 Note any difficulties; make allowances as deemed appropriate.
-
STEP 4 Summarize and date the time study sheet as shown in this example.
Example of tool application

EAN: 2147483647
Pages: 326