Tool 202: Timeline Chart
| AKA | Time Plot |
| Classification | Analyzing/Trending (AT) |
Tool description
A timeline chart is used to plot data fluctuations over time. The chart displays trends, patterns, and shifts that may be very useful in problem analysis, measuring change results, or showing trends that may require immediate action.
Typical application
-
To show yields, trendlines, or patterns that may be used to formulate a problem specification.
-
To measure results of process changes.
-
To track data over time.
Problem-solving phase
| Select and define problem or opportunity | |
| → | Identify and analyze causes or potential change |
| Develop and plan possible solutions or change | |
| Implement and evaluate solution or change | |
| → | Measure and report solution or change results |
| Recognize and reward team efforts |
Typically used by
| 4 | Research/statistics |
| Creativity/innovation | |
| Engineering | |
| 1 | Project management |
| Manufacturing | |
| Marketing/sales | |
| 3 | Administration/documentation |
| Servicing/support | |
| 2 | Customer/quality metrics |
| Change management |
Notes and key points
-
Timeline construction: Time is always represented on the horizontal axis, frequency and percentage is shown on the vertical axis.
before
-
Data Collection Strategy
-
Frequency Distribution (FD)
-
Checksheet
-
Defect Map
-
Cluster Analysis
after
-
Trend Analysis
-
Monthly Assessment Schedule
-
Starbursting
-
Problem Specification
-
What-If Analysis
Step-by-step procedure
-
STEP 1 As a preliminary activity, a data collection process records data on a checksheet or some other record.
-
STEP 2 A timeline chart is drawn. Time intervals are evenly spaced across the horizontal axis, and frequency or percentage is scaled on the vertical axis.
-
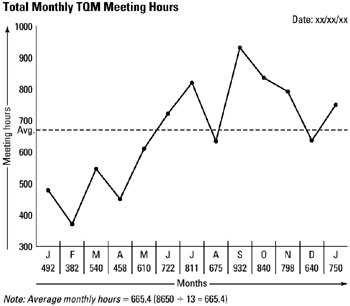
STEP 3 The data (data points) are plotted across the timeline chart, and lines are drawn to connect the data points to show a continuous timeline. See example Total Monthly TQM Meeting Hours.
-
STEP 4 A monthly hours average is computed and drawn on the chart, as shown in this example.
-
STEP 5 Finally, the timeline chart is checked for data accuracy and dated.
Example of tool application
EAN: 2147483647
Pages: 326