Tool 155: Quality Chart
| AKA | N/A |
| Classification | Changing/Implementing (CI) |
Tool description
A quality chart is used to monitor quality metrics within any operation of an organization. The chart is a simple data collection form that reflects actual data and the results of continuous improvement efforts toward an established performance goal.
Typical application
-
To publicly display the results of problem-solving teams on particular quality concerns.
-
To monitor and track quality metrics within the organization.
-
To identify quality of performance discrepancies.
Problem-solving phase
| → | Select and define problem or opportunity |
| → | Identify and analyze causes or potential change |
| Develop and plan possible solutions or change | |
| → | Implement and evaluate solution or change |
| Measure and report solution or change results | |
| Recognize and reward team efforts |
Typically used by
| Research/statistics | |
| Creativity/innovation | |
| Engineering | |
| Project management | |
| 3 | Manufacturing |
| Marketing/sales | |
| 2 | Administration/documentation |
| Servicing/support | |
| Customer/quality metrics | |
| 1 | Change management |
before
-
Information Needs Analysis
-
Data Collection Strategy
-
Sampling Methods
-
Checksheet
-
Observation
after
-
Problem Analysis
-
Potential Problem Analysis (PPA)
-
Cost of Quality
-
Process Analysis
-
Countermeasures Matrix
Notes and key points
-
Quality charts can be used for any function within the organization. Ideally, they display historical data, recent data trends, and established goals for quality improvement.
Step-by-step procedure
-
STEP 1 A preprinted quality chart is publicly displayed in a hallway or other open space.
-
STEP 2 A problem-solving team decides on the type of data and over what period of time the data is to be collected.
-
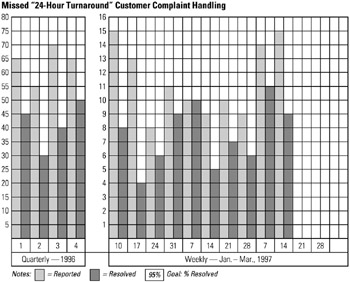
STEP 3 The quality chart is prepared to reflect the quality concerns, type of data, quarters, weekly dates, and the established goal(s). See example Missed "24-Hour Turnaround" Customer Complaint Handling.
-
STEP 4 Data is collected and posted on an ongoing basis, as shown in this example.
-
STEP 5 The team continues to work on the identified problem areas and measures its improvement programs.
Example of tool application
EAN: 2147483647
Pages: 326