Tool 120: Numerical Prioritization
| AKA | Instant Priorities, Pairwise Ranking |
| Classification | Evaluating/Selecting (ES) |
Tool description
Introduced by Richard Bolles, the numerical prioritization tool is reflective of a systematic process of ranking items by preference or user's choice. Similar to paired comparisons, this choosing between paired items will result in a ranking frame of all listed items. This process simply guides the user (or team) through the item prioritization process without undue user bias.
Typical application
-
To prioritize a list of action items, problems, or choices.
-
To allow a team decision to be made on the basis of comparing all options on a list.
-
To combine the individual rankings of team participants to arrive at an unbiased collective team ranking of items.
-
To reach team consensus without lengthy discussion.
Problem-solving phase
| → | Select and define problem or opportunity |
| → | Identify and analyze causes or potential change |
| Develop and plan possible solutions or change | |
| Implement and evaluate solution or change | |
| Measure and report solution or change results | |
| Recognize and reward team efforts |
Typically used by
| Research/statistics | |
| Creativity/innovation | |
| Engineering | |
| Project management | |
| Manufacturing | |
| 3 | Marketing/sales |
| 4 | Administration/documentation |
| Servicing/support | |
| 1 | Customer/quality metrics |
| 2 | Change management |
before
-
Consensus Decision Making
-
Importance Weighting
-
Criteria Filtering
-
Phillips 66
-
Countermeasures Matrix
after
-
Action Plan
-
Project Planning Log
-
Cost-Benefit Analysis
-
Basili Data Collection Method
-
Action and Effect Diagram (AED)
Notes and key points
-
If any item numbers are circled the same number of times, the tie can be broken by checking which number was circled when the selection was made between the pair of item numbers which are tied.
Step-by-step procedure
-
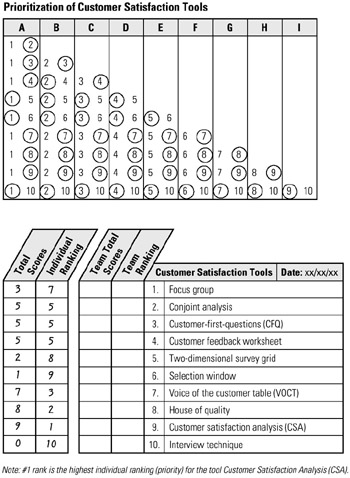
STEP 1 The team develops or introduces a list of 10 items to be numerically prioritized. See example Prioritization of Customer Satisfaction Tools.
-
STEP 2 A nine column (A-I) matrix is constructed on a flip chart (see example). The list of 10 items is placed alongside the matrix; in easy view of all team participants.
-
STEP 3 Participants start their individual ranking by comparing item 1 with item 2 of column A and circling their choice. Moving down the column, this ranking is continued for each pair of items and in all remaining columns until the last choice has been circled in column I. If there are fewer than 10 items on your list, stop when the last choice in the column has been circled.
-
STEP 4 The next step is to total the number of times a particular item was chosen. Place the totals in the item chart.
-
STEP 5 The 10 items are ranked from highest number of circles (choices) to the lowest number of circles. The resulting rank-ordered list reflects an individuals numerical prioritization.
-
STEP 6 When individual scoring has been completed, tallies are added to get a team total.
-
STEP 7 Rank again the total scores of items to get the team's decision.
-
STEP 8 Lastly, date the final list.
Example of tool application
EAN: 2147483647
Pages: 326