Tool 109: Milestones Chart
| AKA | Planning Schedule |
| Classification | Planning/Presenting (PP) |
Tool description
A milestones chart displays all activities (milestones) and their corresponding start and completion dates. It is used to manage and monitor a project and can serve as a supporting document when attached to a project status report.
Typical application
-
To plan and schedule project activities.
-
To track and monitor the progress of a project.
-
To aid project status reporting.
Problem-solving phase
| Select and define problem or opportunity | |
| Identify and analyze causes or potential change | |
| → | Develop and plan possible solutions or change |
| → | Implement and evaluate solution or change |
| Measure and report solution or change results | |
| Recognize and reward team efforts |
Typically used by
| Research/statistics | |
| Creativity/innovation | |
| Engineering | |
| 1 | Project management |
| Manufacturing | |
| Marketing/sales | |
| 3 | Administration/documentation |
| Servicing/support | |
| Customer/quality metrics | |
| 2 | Change management |
before
-
Deployment Chart (Down-Across)
-
Action Plan
-
Countermeasures Matrix
-
Project Planning Log
-
Activity analysis
after
-
Major Program Status
-
Monthly Assessment Schedule
-
Objectives Matrix (OMAX)
-
What-If Analysis
-
Presentation
Notes and key points
-
Legend:
 complete
 incomplete
 -
Optional: Include a column to provide space for listing who or which team has responsibility for completing each activity.
Step-by-step procedure
-
STEP 1 The team first identifies all major activities of the project to be scheduled.
-
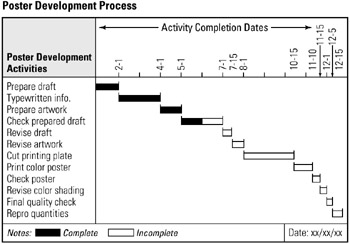
STEP 2 The team constructs a milestones chart and lists all identified activities in the order of completion. See example Poster Development Process.
-
STEP 3 The team estimates the time required to complete each activity and assigns a completion date to each.
-
STEP 4 Next, the team draws a horizontal bar for each activity, placing the bar in accordance with start and completion dates in sequential order along the milestones chart, as shown in the example.
-
STEP 5 The team then checks all information and dates the chart.
Example of tool application
EAN: 2147483647
Pages: 326