6.3 Preliminary Analysis of the Workload
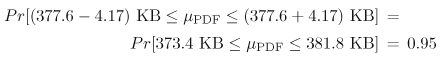
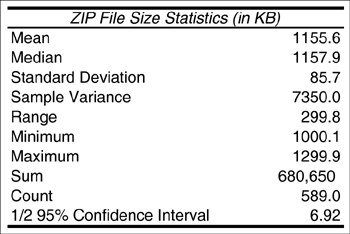
| In order to obtain a first-cut analysis of the workload of this Web server, the entries in the Log worksheet are sorted by file type, then by file size, using Excel's Data PDF Statistics: Figure 6.1 shows the basic statistics for the 411 PDF files in the log (i.e., 41.1% of all downloaded files). As seen, the average size of a PDF file retrieved during the interval is 377.6 KB. The sample standard deviation is 43.1 KB. From these statistics, the coefficient of variation (i.e., the ratio between the standard deviation and the mean), CPDF, is computed as This CPDF is relatively small and indicates that the set of all PDF files can be modeled as a single class in the ensuing performance model. [Note: A good rule-of-thumb is that if the coefficient of variation in a data set is less than 0.25, it is safe to assume the data set forms a single class. For higher values of the coefficient of variation, further data clustering (e.g., see Chapter 4) may be required.] Figure 6.1. Basic statistics for PDF file sizes. Confidence Intervals: The last row of the table in Figure 6.1 indicates the 95% confidence interval for the mean size of downloaded PDF files. It is important understand the meaning of this number. This number indicates that one can say with a probability of 0.95 that the actual average of the size of PDF files is within 4.17 KB of the sampled average (i.e., 377.6 KB). That is, the actual average refers to the mean of the underlying distribution of downloaded file sizes, whereas the sampled average refers to the mean of only these particular 411 files downloaded in this sample. The actual average is unknown, since the true underlying distribution is also unknown. The sample average is known from 411 sampled files. Thus, in this example, the 95% confidence interval is 377.6 KB ± 4.17 KB, indicating that the unknown actual average is within this interval with probability 0.95. [Note: In Fig. 6.1, the "1/2" implies that 4.17 KB may be above or below the sample mean. The sample mean lies in the middle of the confidence interval.] Understanding confidence intervals and their use is important for experimental performance engineering work because the sample mean (i.e., the average value obtained from a sample) by itself does not tell the complete story. Suppose that separate samples of file sizes are observed over a large number of days (e.g., one sample each day) and that the mean file size is computed for each day's sample. These sample means would not be all equal. Which sample mean should be chosen to correctly parameterize a QN model? Should the average value of the daily sample means be chosen? Should the average value of the total conglomerate number of file sizes be chosen? Two important questions are: i) What is the relationship between the actual average value of a distribution and the observed average value of the sample mean? and ii) How is a confidence interval for the mean computed? These questions are answered in turn. Let c be the half width of a confidence interval, m be the expected value of a the underlying distribution, and Equation 6.3.1 for a 100 (1 a)% confidence interval. The value 1 a is called the confidence coefficient. Consider the PDF files again. The expression in Eq. (6.3.1) for a 95% confidence interval becomes Equation 6.3.2 Thus, the confidence coefficient is 0.05 and the average size of retrieved PDF files is in the interval [373.4 KB, 381.8 KB] with a probability of 0.95. The half width, c, of the confidence interval is obtained from the Central Limit Theorem [3] as Equation 6.3.3 where s is the sample standard deviation, n is the sample size, and z1 a/2 is the (1 a/2)-percentile of a normal distribution with a mean of 0 and a standard deviation of 1. Practically speaking, c can be computed using MS Excel's CONFIDENCE function as Equation 6.3.4 ZIP Statistics: Similar statistics for ZIP files are presented in Fig. 6.2. In this case, there are 589 downloaded ZIP files (i.e., 58.9% of the total). The average size of a downloaded ZIP file is in the interval [(1155.6-6.92) KB, (1155.6 + 6.92) KB] = [1148.7 KB, 1162.5 KB] with a probability of 0.95 (i.e., with 95% confidence). The coefficient of variation, CZIP, for the size of ZIP files can be easily computed (i.e., CZIP = 85.7/1155.6 = 0.074). Since CZIP, like CPDF, is also very small, all ZIP files belong to the same class in the performance model. Figure 6.2. Basic statistics for ZIP file sizes. |
 Sort facility. The result is recorded in the SortedLog worksheet of WSData.XLS. Then, the Descriptive Statistics facility of Excel (see Tools
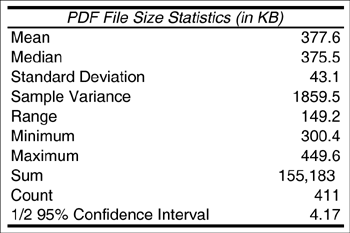
EAN: 2147483647
Pages: 166
- Challenging the Unpredictable: Changeable Order Management Systems
- Enterprise Application Integration: New Solutions for a Solved Problem or a Challenging Research Field?
- The Effects of an Enterprise Resource Planning System (ERP) Implementation on Job Characteristics – A Study using the Hackman and Oldham Job Characteristics Model
- Relevance and Micro-Relevance for the Professional as Determinants of IT-Diffusion and IT-Use in Healthcare
- Development of Interactive Web Sites to Enhance Police/Community Relations