7.11 Machine-Learning Software Suites
7.11 Machine-Learning Software Suites
These data mining software products incorporate visualization, statistics, neural networks, and machine-learning algorithms in multiple and sometimes linkable components. These are high-end toolboxes that can be used for classification and segmentation. Other components can be used for clustering and visualization processes. These are the most advanced and expensive data mining software packages on the marketplace. Prices can range from $10,000 to $50,000 for a single license; these products can deal with very large data sets and take full advantage of multiple fast processors.
ANGOSS
http://www.angoss.com/
KnowledgeSTUDIO from ANGOSS, a Canadian firm, features multiple data mining models in an easy-to-use interface. This is a high-performance interactive decision tree analytical tool with neural networks and clustering components. Data can be imported from a wide variety of file formats including ASCII, dBase, Excel, ODBC, SAS, and all other major statistical packages. In a sufficiently powered data warehouse or data mart, the user can identify a table or view and mine it while the data resides in the database (known as "in-place" mining).
ANGOSS has one of the best decision tree components in the industry for exploring and visualizing relationships in a data set. The user has total control of how the decision trees can be developed and, once the data is split, even more flexibility to explore multiple views from any variable in the data set. The decision tree component has been under development and refinement for over 20 years and is a highly reliable software product for the investigative data miner.
The user has total flexibility in seeing how the data can be split on the basis of a desired output. For example, in a decision tree used to segment among high, medium, and low alerts for our smuggler detection system, trees can be generated on the basis of any desired attribute in the database. Here, for example, we split the data on the basis of type of residence (see Figure 7.25). This is information collected by an insurance carrier. Note how Condo Owners and Mobile Home Owners have a higher probability of generating a high alert.
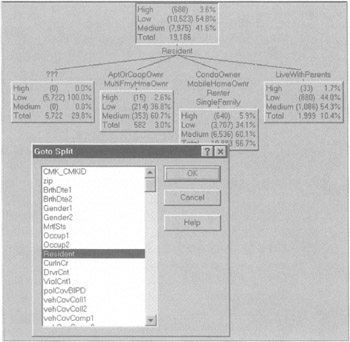
Figure 7.25: Decision trees can be split on any desired variable in the database.
This tool, as with most decision tree software, makes it easy to ask such questions as Who is likely to be a smuggler? directly from the data. Here, for example, a decision tree is split on the basis of the make of the automobile, rather than the type of residence (see Figure 7.26).
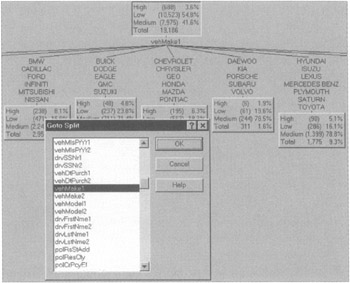
Figure 7.26: Decision tree split on the basis of vehicle make.
The decision tree can be grown interactively or automatically; colored maps, reports, and graphics can also be inserted once the tree is built. KnowledgeSTUDIO can perform multiple types of analyses. All the user needs to do is select whether he wants a decision tree, a clustering analysis, or a neural network to be inserted (see Figure 7.27).
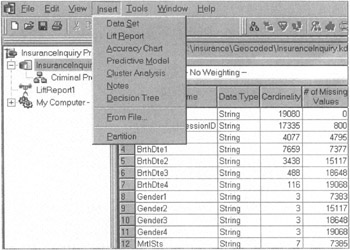
Figure 7.27: Multiple analyses can be performed by inserting them via a drop window.
An assortment of instruments is available for viewing the results of the various machine-learning analyses this tool can perform, such as a lift report. A lift is the improvement on predicting a desired output, such as an event, action, or profile, over random chance. The straight line in Figure 7.28 is random chance, while the curve is the improved performance when the model (rules) is used.
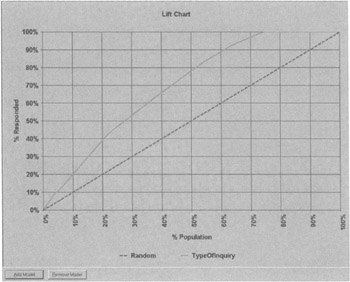
Figure 7.28: Note the improved performance at 70% of population.
As with most of this class of data mining suites, simply constructing predictive classification analyses and models is not enough. The results need to be exportable to production applications, such as a profiling system for an alert system over a network. ANGOSS is able to export code in various formats (see Figure 7.29).
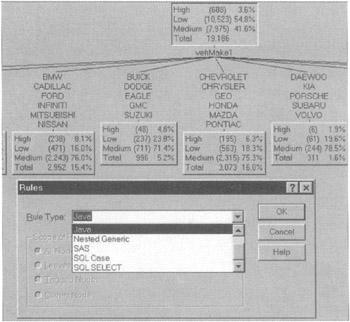
Figure 7.29: Rules can be produced in various formats.
Code can be generated from the decision tree or neural network components. This is the output from the rules-type generator in Java code (see Figure 7.30).
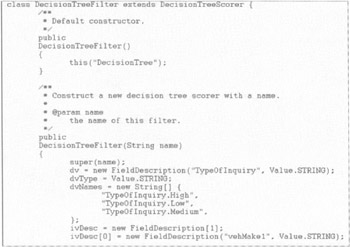
Figure 7.30: Partial view of rules generated in Java from this tool.
A neural network analysis can also be inserted once the data has been imported into the tool (see Figure 7.31).
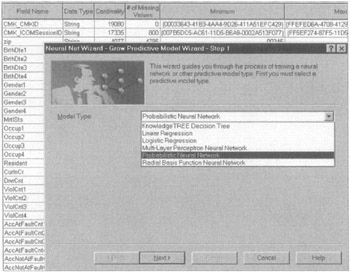
Figure 7.31: The Neural Net Wizard interface.
Different types of neural networks can be constructed with Knowledge-STUDIO. The tool also has a clustering component using a Nearest Neighbor algorithm. The interface is fairly easy to navigate, enabling the user to create, test, and compare multiple analyses very quickly and easily.
Megaputer
http://www.megaputer.com
PolyAnalyst from Megaputer is another machine-learning software suite. It includes an information gain decision tree among its 11 different modeling algorithms. Developed originally in Russia, PolyAnalyst has been on the U.S. market for several years and supports one of the largest numbers of modeling algorithms, including a text mining component.
A broad selection of exploration engines allows the user to predict values of continuous variables, explicitly model complex phenomena, determine the most influential independent variables, solve classification and clustering tasks, and find associations between events. The ability to present the discovered relations in explicit symbolic form is a unique feature of this tool. As with other high-end software suites, this program has a point-and-click GUI interface, which support versatile data import, manipulation, visualization, and reporting capabilities (see Figure 7.32).
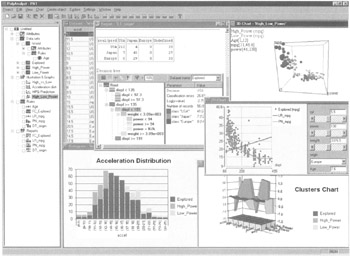
Figure 7.32: This is PolyAnalyst's main window.
PolyAnalyst can access data held in Oracle, DB2, Informix, Sybase, MS SQL Server, or any other ODBC-compliant database, including IBM's Visual Warehouse Solution or Oracle Express. PolyAnalyst includes a flexible Data Import Wizard that automates the task of accessing data in multiple locations and formats (see Figure 7.33).
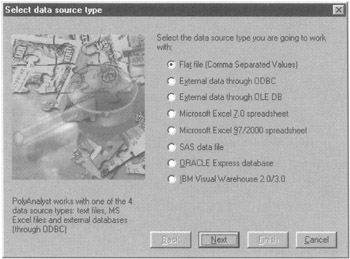
Figure 7.33: This is the data import wizard interface.
This software suite supports a wide array of data manipulations and mathematical transformation, so that rules, automatically discovered by PolyAnalyst or entered by the user, can be used to produce new fields, such as ratios (see Figure 7.34).
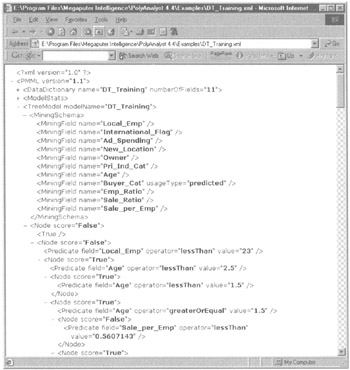
Figure 7.34: The Visual Rule Assistant simplifies rule generation.
The machine-learning menu in this suite is extensive, supporting the following data mining processes:
-
Memory case-based reasoning (CBR) for multiple group classification
-
Multidimensional distribution analysis for finding dependencies
-
Market basket analysis via transactional data processing
-
Symbolic knowledge acquisition technology (SKAT)
-
Discriminate analysis for unsupervised classification
-
Clustering via localization of anomalies
-
Multiple neural networks architectures
-
Decision trees via information gain
-
Stepwise linear regression
-
Fuzzy-logic classification
-
Summary statistics
The latest addition to this data mining suite is that of a decision tree exploration engine. It can assist in solving the classification of cases into multiple categories, such as high, medium, and low alerts. The decision tree component can work with up to 5,000,000 records and is very quick because it does not require loading all the data into the main memory of a server simultaneously. A decision tree report provides an assortment of statistics, such as the number of nonterminal nodes, number of leaves, the depth of the constructed tree, the classification statistics, etc. (see Figure 7.35).
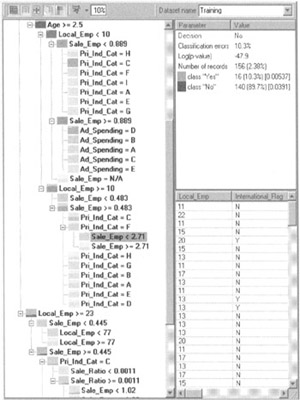
Figure 7.35: Decision tree interface with summary statistic window.
Prudsys
http://www.prudsys.de/discoverer
The prudsys DISCOVERER 2000 data mining is based on nonlinear decision trees. The system is suitable for individual qualification and the creation of profiles. The data and text import module automatically recognizes the structure of text files (see Figure 7.36).
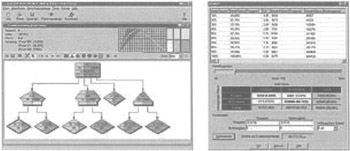
Figure 7.36: A schematic decision tree.
A statistics module offers the user various options for statistically evaluating target databases. A classification module allows for the data to be visualized and evaluated in the form of linear or nonlinear decision trees.
Once the decision tree is created, the user can choose from various function classes:
-
Axis-parallel discriminant function
-
Linear discriminant function
-
Quadratic discriminant function
-
Cubic discriminant function
-
Discriminant function of fourth degree or higher
The most important feature of this tool consists of its continuous quality control through measurement charts (gains, lift, and ROC charts) during the entire computation and creation of decision trees. Problems, such as over-fiting, and over-training with a lack of generalizing, can be visualized and eliminated with the interactive charts.
Oracle
http://www.oracle.com/ip/analyze/warehouse/datamining
Oracle9i Data Mining suite, formerly Darwin, is a multiple-paradigm data mining software package, which has been embedded within the database, with all model-building and scoring functions available through a Java-based API. What makes this suite unique is that Oracle9i provides the infrastructure for application developers to build integrated business intelligence applications without having to extract the data and mine it in a specialized analytical server.
The tool supports an open standard for data mining via the Java Data Mining API. Since it is embedded in the database, Oracle9i Data Mining simplifies the process of extracting hidden intelligence from large data sets. This suite eliminates off-loading vast quantities of data to external special-purpose analytic servers for data mining and scoring. With this suite all the data mining functionality is embedded in the database, so the data, data-preparation, model-building, and model-scoring activities remain imbedded. Oracle9i Data Mining takes advantage of Oracle's parallelism for faster computing.
Quadstone
http://www.quadstone.com
Decisionhouse is Quadstones flagship software suite (see Figure 7.37). It provides data extraction, management, preprocessing, and very powerful visualization features. It supports segmentation, scoring and geographical display mapping. An analysis from one component such as a decision tree can be linked to charts and maps or a regression tool. This is a unique and very powerful feature of this tool.
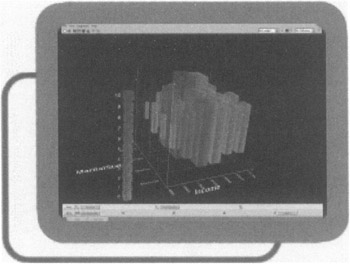
Figure 7.37: Decisionhouse graphical displays.
Decisionhouse data mining suite features include the following:
-
Data extraction
-
Multidimensional visualization
-
Data Enhancement and manipulation
-
Geographical mapping display
-
Data preprocessing
-
webmaps
-
Profiling
-
Automated segmentation
-
ScoreCard modeling
Decisionhouse can operate with two additional modules from Quadstone: ScoreHouse and HouseVision. ScoreHouse provides enhanced scorecard modeling capabilities to complement the segmentation, profiling, and visualization functions of Decisionhouse. HouseVision is a lightweight version of Decisionhouse that allows users to distribute their findings in a visual manner to a wider user community.
SAS
http://www.sas.com
Enterprise Miner is the data mining software suite from SAS, the world's largest statistical software company. Enterprise Miner uses what it calls a "Sample, Explore, Modify, Model, Assess" (SEMMA) approach to conducting data mining analyses (see Figure 7.38). SAS believes that beginning with a statistically representative sample of a data set, this methodology makes it easy to apply exploratory statistical and visualization techniques, select and transform the most significant predictive variables, model the variables to predict outcomes, and confirm a model's accuracy.
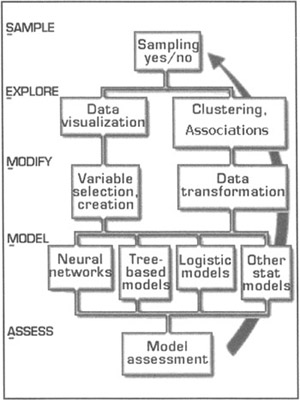
Figure 7.38: Enterprise Miner's SEMMA process.
By assessing the results gained from each stage of the process, SAS believes its SEMMA process can determine how to model new questions raised by previous results, and thus return to the exploration phase for additional refinement of the data. Enterprise Miner incorporates decision trees and neural networks, as well as regression components, memory-based reasoning, bagging and boosting ensembles, two-stage models, clustering, time series, and association tools.
The complete scoring formula for all stages of model development is automatically captured in the form of SAS, C, and Java languages for subsequent model deployment. A reporter tool provides output in HTML for distribution and viewing via a browser. SAS emphasizes that with the Enterprise Miner's GUI and automated framework, users require little statistical expertise. Many corporations and large government agencies are already running the base SAS system and, thus, integration of Enterprise Miner facilitates the process of data mining.
SPSS
http://www.spss.com/spssbi/Clementine
Clementine is SPSSs data mining suite. It is a totally icon-driven tool that supports a visual rapid-modeling environment for data mining (see Figure 7.39).
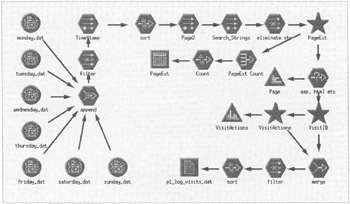
Figure 7.39: Clementine uses icons to perform data mining analyses.
The interactive stream approach to data mining is the key to Clementine's power. Using icons that represent steps in the data mining process, the user can mine a data set by building a "stream"—a visual map of the processes the data flows through. Icons can represent data sources, such as variable types of flat files or ODBC connection. There are also Record Operational icons for excluding, merging, and sampling, records in a database. There are Field Operation icons for filtering and designating data types. There are also graphical icons for creating different types of visual reports. And of course there are also Modeling icons for placing neural networks and machine-learning algorithms in the palette for mining the data. The user typically starts an analysis in Clementine by simply dragging a source icon from the object palette onto the canvas to access the data flow.
The user can start by exploring the data via a table or a graph icon to visually display the data prior to bringing to the canvas various algorithm icons to construct models, the results of which are represented as gold nuggets. SPSS provides Clementine users with prebuilt streams, which it calls Clementine application templates (CATs), and is planning on including a COP CAT for law enforcement applications.
The Clementine application template for crime and offender profiling (COP CAT) will be based on the existing work of the West Midlands, U.K. Police Department on extracting and using crime and offender profiles. This case study is described in more detail in Chapter 12. The COP CAT will include five modules:
-
Police resources and incident "hot spots" identify locations where requests for assistance from members of the public are likely to be high volume in a given time period, which will be based on a recent history of requests.
-
Patterns of individual offenders, given a number of offenses committed by the same individual, identify common patterns of MO and score unsolved crimes against this profile.
-
For patterns of groups of offenders, where the offenses are committed by a group of connected offenders rather than a single individual, a geographical component is used to identify hot spots for a particular group or network.
-
Combining patterns of offenders and MOs and suspect descriptions: for those types of crime where suspect descriptions are often available (e.g., "bogus official" burglaries), this improves the accuracy of scoring.
Modules 1 to 4 are designed to use the type of information typically collected by police forces for all reported crimes.
-
For patterns of offending for serious crimes (e.g., armed robbery) a more detailed description of the offense and circumstances is typically available.
In addition, SPSS is also planning to develop a CAT to target government fraud, which will be along two separate types of streams: one is the typical "train and test," while the other looks for outliers.
In the first stream, government agencies may be interested in identifying fraud, waste, or abuse in their vendor payment system, as in the case study in Section 7.7. They may have completed an audit of a small subset of the transactions and have identified only a very small percentage of these cases as actually incorrect or fraudulent transactions. Of course, the analysts will need to use this data in the best possible way to both train and test the model, then reapply that model to other transactions, hoping to find additional cases. There are various reasons identified to be the cause of vendor payment error, including multiple payments to the same vendor for the same cost, billing a cost center for a product that cannot be charged to that cost center, billing for more hours than normal/expected, and billing at much higher rates than expected. There are also a number of cases where the billing was deemed fraudulent, even though the line-item charges appear to be usual. Approaches to identifying fraud include profiling for the prediction of fraud based on historical cases of fraud. It will be clearly noted that fraud frequently transforms itself and other means of analysis are necessary to find "new fraud."
In the second stream, a government agency pays providers for service rendered. However, analysis in this case does not include any instances where fraud, waste, or abuse have been identified. In this situation the objective is to narrow the work down by identifying abnormal cases in the data set. Historically, claims have been reviewed at the claim level, with a series of audit checks performed to ensure that each claim meets the criteria for payment. The analysis performed in this CAT will aggregate each claim so that analysis can be performed at the provider and the customer levels in order to find unusual behavior. Approaches to identifying fraud can include the following:
-
Data cleaning for removal of duplicate entries
-
Application of Beneford's Law to find nonconforming groups
-
Data aggregation for the identification of acceleration
-
Provider clustering for identification of unusual cases of providers or cluster movement over time
-
Customer clustering for identification of unusual customers and cluster movement over time
-
Ping-ponging identification
-
Unbundling and unusual sets of claims identification
SPSS is making a concerted effort to develop data mining application solutions in the areas of criminal and fraud detection, as well as developing CATs for countering bio-terrorism. Several case studies will illustrate how Clementine is being used in the detection of potential government agency fraud and the clustering of crimes and criminal MOs.
Teradata Warehouse Miner
http://www.teradata.com
NCR has developed Teradata Warehouse Miner a highly scalable data mining system for NCR's Teradata Relational Database Management System (RDBMS) software customers. Teradata Warehouse Miner complements traditional data mining software for Teradata customers by addressing the need to handle large volumes of data in a scalable manner. TeraMiner does this by providing data mining functions that operate directly on the data within the Teradata database via programmatically generated SQL. This facilitates data mining without having to move the data, and using as much of the data as desired, while storing the results directly in the database, and utilizing the parallel, scalable processing power of Teradata to perform data intensive operations. This is a unique data mining paradigm and is quite appropriate for analyzing very large data sets in data warehouses.
Models are represented in XML and are integrated inside the database warehouse system, SQL can be directly exported and integrated for real-time deployment. Teradata Warehouse Miner has a Windows-based user interface for model development, deployment and project management. A complete set of descriptive statistics are provided along with data visualization charts, plots, decision trees and graphs. Organization and partitioning functions are provided for data preparation, transformation and data reduction.
All of the major analytic algorithms are supported by Teradata Miner including linear and logistic regression, factor analysis, rule induction and decision tree, clustering and association/sequence analysis. This tool represents a next generation machine learning software suite in that the analytical model building, testing and deployment is constructed within the database itself. This design allows for leveraging the parallel processing of the RDBMS software, enabling for the analysis of large volumes of detailed data and quick deployment in such applications as fraud detection (see Figure 7.40).
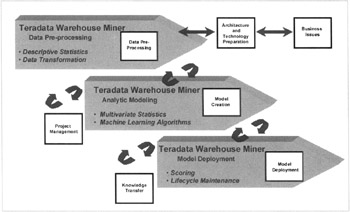
Figure 7.40: NCR's Data Mining Method and Teradata Warehouse Miner Technolgoy.
thinkAnalytics
http://www.thinkanalytics.com
This vendor takes a unique approach to providing multiple data mining algorithms via its flagship product K.wiz, a suite designed specifically for integration into production applications. The suite is based on Java and XML, allowing its SDK to be integrated with messaging systems, application servers, and component technologies, as well as existing enterprise systems, such as those of IBM, SAS, and Siebel. K.wiz was designed from the outset to be embedded in other systems using a component-based architecture. The components can be any of several algorithms, including decision trees, regression, neural networks, naive bayes, KMeans, K-nearest neighbor, and Kohonen neural networks. thinkAnalytics is headquartered in Glasgow, Scotland, United Kingdom.
EAN: 2147483647
Pages: 232
- Chapter II Information Search on the Internet: A Causal Model
- Chapter IV How Consumers Think About Interactive Aspects of Web Advertising
- Chapter V Consumer Complaint Behavior in the Online Environment
- Chapter VI Web Site Quality and Usability in E-Commerce
- Chapter XI User Satisfaction with Web Portals: An Empirical Study