Lesson 2: Performing Scheduled Exchange Server 2003 Monitoring and Maintenance
Scheduled monitoring enables you to accumulate data that provides the information you require for trend analysis and capacity planning. By measuring system performance over time, you can identify the need for new resources before that need becomes critical, and use the collected data to troubleshoot your servers before faults occur that affect your users.
After this lesson, you will be able to
-
List the maintenance tasks that you need to schedule
-
Generate reports and identify trends
-
Review protocol logs
-
Explain the purpose of HTTP Monitor
-
Manage mailbox limits
-
Manage the Badmail folder
-
Manage the postmaster mailbox
Estimated lesson time: 90 minutes
Scheduled Maintenance Tasks
To keep your Exchange organization running smoothly and to provide the level of service that users demand, you need to perform regular, scheduled maintenance tasks. You must define these tasks and the frequency with which you perform them. Typically, you need to perform the following tasks:
-
Generate reports and identify trends by using System Monitor, Microsoft Operations Manager, or third-party utilities to capture performance data. This data allows you to identify potential bottlenecks and, for example, to estimate when a server must be upgraded.
-
Use protocol logs to track commands that are sent and received by SMTP, NNTP, and HTTP virtual servers. Reviewing these logs can help you troubleshoot messaging problems and identify potential problems.
-
Use HTTPMon to monitor your Outlook Web Access (OWA) servers and ensure that client computers are not experiencing connection or performance problems.
-
Determine which users consume the most resources on your servers because this information helps you configure and maintain your Exchange storage.
-
Monitor the Badmail folder to identify trends and prevent messages from building up. Messages that cannot be delivered and cannot be returned to the sender are sent to the Badmail folder. Over time, these messages can accumulate and use up disk resources.
-
Manage the postmaster mailbox, which is used for NDRs. You should define which e-mail account is associated with the postmaster account and monitor and respond to NDR messages when necessary.
Generating Reports and Identifying Trends
Your first task when generating reports and identifying trends is to gather sufficient information to establish a baseline for the performance of each Exchange Server 2003 server. This information allows you to manage your servers proactively and perform trend analysis and capacity planning. You should create a baseline when you first deploy your server, and then re-baseline whenever changes in hardware or usage occur.
To create a baseline and then use deviations from that baseline to track trends and identify potential problems, you must create procedures to monitor your Exchange Server 2003 server. These procedures gather information about server resources such as memory usage, processor utilization, hard disk space utilization, disk performance, and network performance. In addition, performance indicators specific to Exchange Server 2003 server, such as Exchange store performance, message delivery rates, and message queue problems, are included. Your system monitoring procedures should specify the frequency of monitoring tasks, the baseline data to be captured, and the appropriate procedures for managing any problems that may arise.
System measurement is implicit within system monitoring. System measurement parameters include standards for the types of information measured, measurement sampling rates, methods used to analyze data, data storage formats, and reporting formats.
Capacity Planning
Capacity planning enables you to allocate system resources to ensure that optimal system performance is maintained as the system load increases. It is, however, not sufficient to carry out capacity planning using current data, to allocate the appropriate resources, and then to take no further action. Capacity planning is a continuous process that requires that you establish baselines for each service and then monitor all levels of system operations.
The Performance Console
The Performance console is used to gather and display information about performance objects and related counters. The console contains two tools, or snap-ins: Performance Logs And Alerts and System Monitor.
The Performance Logs And Alerts snap-in records and logs system activity over a period of time. The tool enables you to collect data at regular intervals for the counters you select. You can retain logs over extended periods of time by storing data in a database created by Microsoft Access or Microsoft SQL. If you store the data in a database, you can use the reporting features of the database program to create reports that can be used to assess overall performance and to perform trend analysis and capacity planning. Performance Logs And Alerts can also be configured to generate an alert if a counter value either exceeds or drops below a predefined value. The alert, by default, will record an event in Event Viewer, but you can configure it to send an administrative message or to initiate a program.
The System Monitor snap-in lets you chart activity in real time. You also use it to display information captured in log files by the Performance Logs And Alerts snap-in as reports, graphs, or histograms. You can use System Monitor to view server activity whenever server performance degrades. You can, for example, analyze processor activity and queues and use this information to isolate problems with specific components.
Configuring a Performance Console
You should configure the Performance console so that you can determine what is normal system behavior and what modifications you can make to improve performance. You need to know the average number of messages received per user per day and the total number of messages downloaded in a predefined period of time. You also need to know the frequency with which users open folders.
If you have these statistics, you can calculate the number of additional users that each of your servers can support. However, this is anything but a straightforward calculation. E-mail traffic is not smooth, but rather is notoriously peaky. You also need to know the peak delivery rate, the peak period during the day, the peak day of the week, and whether monthly or quarterly peaks exist.
To obtain this information, you need to create a Performance console that allows you to see the entire system environment and that registers changes in the performance of your servers. The guidelines for creating a Performance console are as follows:
-
Create a Performance console that has two different sample times, for example:
-
900 seconds for a 24-hour view
-
10 seconds to catch short-lived spikes
-
-
Include a minimal set of counters in each console, for example:
-
Memory\Pages/sec
-
Processor(_Total)\% Processor Time
-
Process(store)\% Processor Time
-
MSExchangeIS\RPC Requests
-
MSExchangeIS\RPC Operations/sec
-
PhysicalDisk(_Total)\Disk Transfers/sec
-
SMTP Server\Local Queue Length
-
SMTP Server\Messages Delivered/sec
-
MSExchangelS Mailbox\Local Delivery Rate
-
MSExchangelS Mailbox\Folder Opens/sec
-
MSExchangelS Mailbox\Message Opens/sec
-
-
Examine your busiest server to understand why it is busy and what performance problems can be resolved.
-
Save your reference log files so that you can develop historical baseline data that allows you to see what changes have occurred and to accommodate for additional growth over time.
Analyzing Trends
By analyzing the reports you create using your data, you can uncover patterns and predict future trends. This trend analysis assists you to determine what steps you can take to prevent problems on your Exchange Server 2003 servers in the future. For example, you can predict when normal growth, such as mailbox growth, will require you to upgrade your storage.
Protocol Logs
Protocol logs were introduced, and protocol logging configured, in Chapter 11, "Microsoft Exchange Server 2003 Security." You can use protocol logging to track commands that an HTTP, SMTP, or NNTP virtual server receives from client computers and to track outgoing commands. You should establish a schedule for reviewing protocol logs, and you should also review the log files if your users are experiencing problems.
You can select from four types of file formats, depending on how you want to store the information. Table 13-5 describes these formats.
| Format | Description |
|---|---|
| IIS Log | The information is written to a comma-delimited ASCII text file. The data is fixed, which means that you cannot customize the log. |
| NCSA Common Log | The information is written to an ASCII text file that uses the National Center for Supercomputing Applications (NCSA) format. The data is fixed, which means that you cannot customize the log. |
| ODBC Logging | The information that is logged is written to a database. You must set up an open database connectivity (ODBC)–compliant database before using this format. |
| W3C Extended Log | The information is written to an ASCII text file. The World Wide Web Consortium (W3C) Extended Log file format is the most flexible format because the data is variable, which means that you can choose what you want to track. |
You enable protocol logging and select the log file format for an SMTP or NNTP virtual server by using Exchange System Manager to configure the virtual server properties. You can also specify the schedule for creating new log files and the location of these files (except for ODBC format). If your log file format is W3C Extended Log File Format, you can select the items that you want to track.
You manage HTTP protocol logging by using the IIS Manager console to configure the Web site properties. By default, protocol logging is enabled, and the log file format is set to W3C Extended Log File Format.
Using a Protocol Log File
You can use a protocol log file for general troubleshooting. Suppose, for example, users report that they are receiving messages when their addresses do not appear on the To or Cc lines. In this case, you can use SMTP log file data to compare the recipients specified in a rcpt to command with addresses posted in a message header or in the To and Cc lines of the message. Another example is when you search the SMTP log file for the message identity (ID) of a remote system so that you can collaborate with another system administrator to trace a message.
You can look for response codes that a receiving server returns after your server issues an ehlo command to determine the maximum-size message that a server will accept (for example: 250-size 60000000). You can also use the log data to generate reports. If another server attempts to use your server as a relay (assuming your server is properly configured to prevent unauthorized SMTP relaying), the log file posts a numeric response code of 550, which corresponds to Relaying Prohibited, in the protocol status (sc-status) field. You could write a script to search this field and tally the number of reported 550 codes.
HTTP Monitor
You can use the HTTP Monitor (HTTPMon) Resource Kit utility to monitor Web sites or applications. HTTPMon can check Web sites and report the results to either a log file in comma-separated values (CSV) format or in the Windows Server 2003 server event log. You can then either use Windows Management Instrumentation (WMI) to monitor the event log or import the CSV output into a Microsoft Excel or SQL database for further analysis.
The utility enables you to test that the Exchange Web site is responding to requests from client computers in a timely fashion. It lets you test several sites simultaneously to ensure that they are up and that they are responding within reasonable times. You can use HTTPMon to monitor OWA servers and identify and troubleshoot problems. You should establish a schedule for monitoring OWA on a regular basis.
HTTPMon comprises the following three components:
-
Realtime Sampling Service The real-time monitoring service.
-
SQL Reporting Server Pulls data from monitor servers and loads it into Microsoft SQL Server.
-
Client Monitor A set of Web pages that displays the results from the SQL Reporting Server database.
Installing HTTPMon
Currently, the HTTP Monitoring Tool is available only in the Windows 2000 Resource Kit and is not installed by the Resource Kit Setup program. To install it, insert the Windows 2000 Resource Kit companion CD into your CD-ROM drive. When the Setup screen appears, click Explore The CD. In the <cdroot>\apps\httpmon directory, double-click Setup.exe and follow the directions that appear on your screen.
When you install the HTTP Monitoring Tool, the information file (Readme.txt) and the user's guide (HTTPMon_whitepaper.doc) are also installed. Access these files for information on configuring and using the tool. They are both located in the directory where you install the tool (C:\Program Files\Httpmon in the default installation).
| Tip | You can also download the HTTP Monitoring Tool installation file from ftp://ftp.microsoft.com/bussys/utilities/httpmon. |
Mailbox Limits
You need to manage mailbox limits on a regular basis. By default, Exchange Server 2003 permits large mailbox sizes, and this allows users to store a great deal of information in their mailboxes. However, this can lead to some users having excessively large mailboxes. You can use Exchange System Manager to manage mailbox limits and Event Viewer to check whether mailbox sizes have reached the various limit stages that you configured.
If you access the mailbox node in Exchange System Manager, then you can modify the mailbox view to include the Storage Limits column. This column provides feedback on whether certain limits have been enforced for a specific mailbox and, if so, what condition the mailbox is in. You can then use Event Viewer to view the events recorded when a mailbox reaches a limit threshold. Microsoft recommends that you monitor mailbox sizes at least once per week. Table 13-6 describes the limit settings that you can specify in the Storage Limits column.
| Limit | Description |
|---|---|
| No Checking | Mailbox limits are not enabled for the mailbox. |
| Below Limit | The mailbox has limits set, but the mailbox usage is below these limits. |
| Issue Warning | The mailbox size has reached the Issue Warning limit and a warning message is delivered to the mailbox. |
| Prohibit Send | The mailbox size has reached the Prohibit Send limit and the mailbox-enabled user is no longer able to send messages. |
| Mailbox Disabled | The mailbox size has reached the Prohibit Send and Receive limit and the mailbox is set to Disabled. The mailbox-enabled user cannot send messages from this mailbox, and the mailbox is unable to receive messages. |
You can configure diagnostic logging on an Exchange Server 2003 server to enable you to view events in the application log in Event Viewer that indicate when mailboxes reach the various stages of storage limit warnings. You can also use the mailbox management process, otherwise known as Mailbox Manager, to manage oversized mailboxes.
Mailbox Manager is defined as a recipient policy and can be used to create reports or take actions to clean old mail from users' mailboxes. You can schedule the mailbox management process to run at a specific time for regularly scheduled cleanups, or you can run it manually. You should run the process manually if you are in immediate need of mailbox statistics or if you need to clear mailboxes of old mail immediately.
You start the process by starting Exchange System Manager, navigating to the relevant server, right-clicking the server, and then selecting Start Mailbox Management Process. Mailbox management starts after a short delay, which depends on the level of resource use on the server.
The Badmail Folder
If a message has reached the retry limit and an NDR cannot be delivered to the sender, a copy of the message is placed in the Badmail folder. Messages placed in this folder cannot be delivered or returned.
Over time, messages can accumulate in the Badmail folder. If you do not monitor the Badmail folder regularly, your Exchange Server 2003 server can run out of disk space. This causes the Microsoft Exchange Information Store service to shut down. You need to establish policies for monitoring the folder and removing messages after a certain age. Microsoft recommends reviewing the content of the Badmail folder on a weekly basis.
Another reason for monitoring the Badmail folder is that it could contain messages from an external user who is attempting to relay spam e-mail through your Exchange organization.
By default, the Badmail folder is located in the virtual server's home directory. You can relocate the folder by using Exchange System Manager to access the Messages tab in the relevant virtual server's Properties dialog box. You can use Windows Explorer to check the contents of the Badmail folder. A large number of undelivered messages could indicate delivery problems such as a DNS or network failure, or potential security problems due to spam e-mail. You should delete messages from the Badmail folder based on your organization's policies. For example, you could delete messages once per week.
The Postmaster Mailbox
The postmaster account is configured to receive NDRs and is used to send the delivery status of a message to the sender. By default, Exchange Server 2003 creates the postmaster proxy address and assigns this address to the administrator who created the Exchange organization. It is good practice to change this default setting so that the name of this administrator account is not exposed to outside users.
| Note | Request for Comments (RFC) 822 defines a reserved address for the postmaster. To access RFCs, browse to http://www.rfc-editor.org/rfc.html. |
To designate a specific user's mailbox as the postmaster mailbox for a local SMTP domain, you add the proxy postmaster@localdomainname to the user's list of SMTP proxy addresses. You can associate an existing e-mail account with the postmaster or create a dedicated postmaster account from which the NDRs will be sent.
If you decide to create a dedicated postmaster account, you can log on using that account by using an Outlook profile and respond to the account messages. Alternatively, you can delegate Send As permissions on the account to the person to whom you have delegated the task of managing the mailbox, and add the mailbox to that person's Outlook profile.
You should establish a regular schedule for reviewing and responding to the delivery reports contained in the postmaster mailbox. This schedule should be based on your organization's requirements. Some organizations make this a daily task in an effort to reduce the number of e-mail messages that are delivered to users who are no longer with the organization, while others companies make this a weekly or monthly maintenance task.
Practice: Using Performance and Protocol Logs and Managing Mailbox Limits
In this practice, you configure the Performance Logs And Alerts tool to create a performance log for trend analysis and to generate a report when an Exchange counter exceeds a predefined value. You also check the SMTP protocol log for problems and check for oversized mailboxes.
Exercise 1: Configure a Performance Log
In this exercise, you configure a performance log by adding the counters that you want to monitor and by specifying a sample time. For the purposes of this exercise, a five second sample period is specified. If you wanted to log activity over a long period of time, you would specify a larger sample period, because otherwise the performance log file could grow to an excessive size.
To configure a performance log, perform the following steps:
-
On Server01, from the Start menu, click Administrative Tools, and then select Performance.
-
In the console tree, expand Performance Logs And Alerts.
-
Right-click Counter Logs, and then click New Log Settings.
-
In the New Log Settings Name box, type MyLog and then click OK.
-
On the General tab of the MyLog dialog box, check that the current log file name is the default, C:\PerfLogs\MyLog_000001.blg.
-
Click Add Counters. In the Add Counters dialog box, select Use Local Computer Counters.
-
In the Performance Object drop-down menu, select Processor.
-
Choose the Select Counters From List option. In the scroll box below this option, select %Processor Time.
-
Choose the Select Instances From List option and select _Total.
-
Click Explain to obtain a description of this counter, and then click Add.
-
Use the same technique to add the Process(store)\% Processor Time counter. Figure 13-10 shows this counter being added.
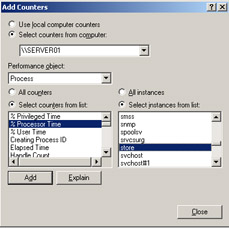
Figure 13-10: Adding the Process(store)\% Processor Time counter -
Add the MSExchangeIS\RPC Requests and the MSExchangeIS\RPC Operations/sec counters.
-
Add the MSExchangelS Mailbox\Local delivery rate, the MSExchangelS Mailbox\Folder opens/sec, and the MSExchangelS Mailbox\Message opens/sec counters.
-
Add the PhysicalDisk(_Total)\Disk Transfers/sec counter.
-
Add the Memory\Pages/sec counter.
-
Add the SMTP Server\(_Total)Local Queue Length and the SMTP Server\ (_Total)Messages Delivered/sec counters.
Note You can choose instances of SMTP Server because you created an additional SMTP virtual server in Chapter 9, "Virtual Servers." If you did not do so, or if you have since deleted that virtual server, then add the SMTP Server\Local Queue Length and the SMTP Server\Messages Delivered/sec counters.
-
Click Close.
-
On the General tab of the MyLog dialog box, set the Sample Interval to 5 seconds.
-
Click OK. If you are prompted to create the C:\Perflogs folder, click Yes.
-
On the Performance console, click Counter Logs and check that the MyLog counter log is running. It should be green in color, and if you right-click it, Start should be dimmed.
-
On Server02, use OWA to send an e-mail to administrator@tailspintoys.com, with copies to d.hall@tailspintoys.com and s.alexander@tailspintoys.com.
-
On Server01, use Outlook 2003 to send an e-mail to administrator@contoso.com, with copies to Don Hall and Sean Alexander.
-
On Server01, create a C:\Temporary folder. Copy the contents of C:\Windows\Drivers into that folder, delete the C:\Temporary folder, and empty the Recycle bin.
Note Steps 21, 22, and 23 are designed to generate entries in the performance counters being monitored. Any other activities that you want to test are equally valid.
-
In Performance Logs And Alerts on Server01, right-click the MyLog log file, and then click Stop.
Exercise 2: Generate a Performance Report
To read the MyLog log file and generate a report, perform the following steps:
-
On Server01, from the Start menu, click Administrative Tools, and then select Performance.
-
In the console tree, click System Monitor.
-
In the details pane, on the toolbar, click View Log Data.
-
In the System Monitor Properties dialog box, access the Source tab, click Log Files, and then click Add.
-
In the Select Log File dialog box, browse to C:\Perflogs in the Look In box (unless already selected).
-
Click the MyLog_000001.blg log file, and then click Open.
-
In the System Monitor Properties dialog box, select the Data tab, and then click Add.
-
In the Add Counters dialog box, add all the counters for all the available performance objects, and then click Close.
-
Click OK to close the System Monitor Properties dialog box.
-
Use the toolbar to view the data in graph, histogram, and report format. Figure 13-11 shows report format.
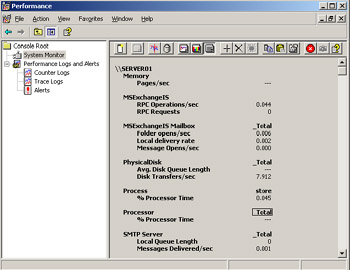
Figure 13-11: Captured data displayed in report format -
Examine the data that you collected to determine whether any performance problems exist that you should act on.
Exercise 3: Read the Default SMTP Protocol Log File
In Chapter 11, you investigated the configuration of protocol logs in general terms. In this exercise, you look at a specific log file. This exercise assumes that you have enabled logging in your SMTP virtual server and that, therefore, the SMTPSVC1 folder exists. If that is not the case, use Exchange System Manager to navigate to the Default SMTP virtual server Properties dialog box, enable protocol logging, and then send an e-mail message to administrator@contoso.com.
-
On Server01, from the Start menu, click Run, type C:\Windows\System32\LogFiles\SMTPSVC1, and then click OK.
-
In the C:\Windows\System32\Logfiles\SMTPSVCl window, open any log file.
-
Read the log file.
-
If the W3SVC1 folder exists, read any log files in that folder. Some log files can hold a lot of information.
-
Close the log files.
Exercise 4: Create a Mailbox Store Policy and a Recipient Policy, and Check for Oversized Mailboxes
In this exercise, you check for oversized mailboxes. In order to do so, you must first create and apply a mailbox store policy and a recipient policy.
-
Start Exchange System Manager.
-
Navigate to Administrative Groups\First Administrative Group\Servers\Server01 \First Storage Group\Mailbox Store (SERVER01)\Mailboxes.
-
Click Mailboxes. On the View menu, click Add/Remove Columns.
-
In the Add/Remove Columns dialog box, in the Available Columns box, click Storage Limits, and then click Add.
-
In the Displayed Columns box, click Move Up until Storage Limits is the second item in the list, as shown in Figure 13-12, and then click OK.
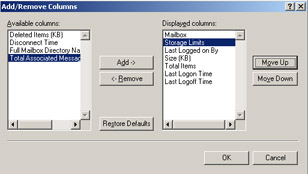
Figure 13-12: Configuring Mailbox View to view storage limits -
In the Mailboxes details pane in Exchange System Manager, view the Storage Limits column to determine whether any mailboxes are over their limit.
Tip Click the Storage Limits column header to sort the data by storage limit status. This lets you locate large mailboxes more easily.
-
To delete items from an over-large mailbox, in Exchange System Manager, navigate to Administrative Groups\First Administrative Group\Servers\Server01, right-click Server01, and then click Start Mailbox Management Process. Mailbox Manager deletes items based on the recipient policy configured for your user mailboxes.
Lesson Review
The following questions are intended to reinforce key information presented in this lesson. If you are unable to answer a question, review the lesson materials and then try the question again. You can find answers to the questions in the "Questions and Answers" section at the end of this chapter.
-
You configure protocol logging on your Default NNTP virtual server and your Default SMTP virtual server. You use Exchange System Manager to access the Properties dialog box of your Exchange virtual server, but the controls to configure protocol logging do not exist. How can you configure protocol logging on your Exchange virtual server?
-
You enable and configure protocol logging on the Default SMTP virtual server on one of your Exchange Server 2003 servers. You do not want to log all available items, but instead want to select the items to track. Which log file format should you specify?
-
IIS Log
-
NCSA Common Log
-
W3C Extended Log
-
ODBC Logging
-
-
A user reports that when she sends an attachment to a particular recipient, she receives an NDR. You suspect that the Exchange Server 2003 server used by the recipient has a size limit for inbound messages. How can you determine what this size limit is?
Lesson Summary
-
You should regularly monitor performance counters to detect anomalies and track trends. You need to review protocol logs, manage mailbox limits, manage the Badmail folder, and manage the postmaster mailbox on a regular basis.
-
The HTTP Monitor Resource Kit tool can be used to monitor Web sites and OWA servers.
-
Protocol logs can record all the traffic sent to a virtual server. The information in a log file can be stored in one of four different formats. Only W3C Extended Logging format lets you select what objects to track.
-
The Badmail folder stores mail when it cannot be delivered and an NDR cannot be sent to the sender. The postmaster mailbox stores NDRs for mail that has been sent to non-existent users in your domain.
-
You can monitor mailbox size and log events in the application log in Event Viewer when specified limits are reached. You can also use Exchange System Monitor to view mailbox properties, including mailbox size.
EAN: 2147483647
Pages: 221