Development Products
| Good documentation is critical for successful development and successful testing. A development process will generate a collection of work products that represent the system under development and/or the requirements for it. The form and content of those products will be determined by many factors, including the corporate policies, the skills and expertise of developers, and the schedule constraints. These products are written in a variety of notations. In this book we use the Unified Modeling Language (UML) [RJB98] as the conceptual modeling language and C++ as the programming language. The end products of any software development effort are code and the documentation for that code, including user manuals and maintenance documentation. Other development work products are typically produced, including analysis and design models, architectural models, and requirements that influence the quality of the system being produced. These products have a lifetime longer than the current project and may be reused on other development efforts. In this section, we describe a set of products that we think are essential to the successful development of object-oriented software. We use the UML in our examples.[12] Your products might be written in another notation, but the models should in some way capture the same information that we describe in this section. Since these products are models that represent the software, we will discuss them from a testing perspective.
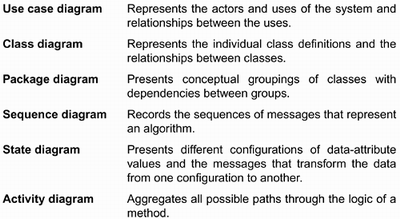
In UML, a model is a collection of diagrams. Each model captures the system at a specific level of abstraction. We present these models because in Chapter 4, we will talk about how to conduct a "system" test with models rather than code. The kinds of UML diagrams we use for system modeling are listed in Figure 2.9. Figure 2.9. UML diagrams used in this book
Analysis ModelsAnalysis comprises the activities in a software development process whose purpose is to define the problem to be solved and to determine requirements for a solution to that problem. In our development process, two levels of analysis domain and application are performed:
Commonalities among concrete classes might be reflected by the use of interfaces or abstract classes, such as Brick in Figure 2.7. These commonalities might be identified as abstractions during domain analysis or might be synthesized based on the features common to two or more concrete classes identified during application analysis. In terms of testing the representations of software generated during analysis, we do not need to distinguish between the products of domain analysis and application analysis. The difference will be reflected by the scope of the model (domain models are very broad) and by the level of completeness at which testing is performed (domain analysis models contain less detail). Object-oriented analysis centers on what the system does from the perspective of the kinds of objects involved and how the objects are related to one another. Analysis encompasses classifying objects in the problem, including the identification of relevant attributes and operations, the identification of relationships between classes and instances of various classes, and the characterization of the behavior of the various kinds of objects. These are represented in a model comprising different kinds of diagrams.
An analysis model represents a system from the perspective of what it is supposed to do. The purpose of an analysis model is to provide developers, their clients, and other stakeholders with an understanding of the problem and the requirements for a solution. Typically, analysis efforts will produce a restatement of the requirements specification written first, from a development perspective as opposed to a marketing perspective and second, from a model of the problem to be solved described in terms of objects. A variety of diagrams is used to present the system from different views. Viewed from the testing perspective, the various diagrams that comprise the representation might contain incorrect information or might not represent the same information consistently in all diagrams; or, the model might not completely capture all of the necessary information. In Chapter 4 we will address testing these representations. We now describe some of these diagrams, which will serve as the basis for both development and testing. Use Case DiagramIn object-oriented development, requirements are captured quite effectively by a collection of use cases and supporting diagrams. The description of Brickles in Chapter 1 expresses the components and rules of the game in natural language and pictures. This description is a reasonably good definition of the required software, although it leaves some requirements open for interpretation such as the size of the play field, the tone of a consolation message, whether a player can "exit" if the game is paused, the size and speed of a puck, and how sensitive paddle movement is to mouse movement. A use case describes a use of the system by an actor to perform some task. Actors really represent the various roles users[13] play with respect to the system that is, one person can use a system in several different roles. There is one actor in Brickles as it was described in Chapter 1 namely, the player, who is involved in the actual play of the game. We could postulate another actor for Brickles who is responsible for establishing some parameters for the game as it is installed on different computers for example, the speed of the puck; the size of the initial puck supply; and the colors of the bricks, puck, paddle, and play field. The specification does not identify such an actor, but a good analyst would consider the need for an administrative user of the system. Of course, the person who installs Brickles on a system can also be a player. (See [FoSb99] or [JCJO92] for a discussion of use cases.)
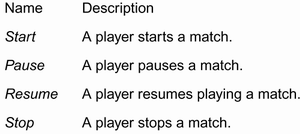
Use cases can be expressed in various levels of abstraction. Consider, for example, some high-level uses of Brickles by a player shown in Figure 2.10. Figure 2.10. Domain-level use cases for arcade games
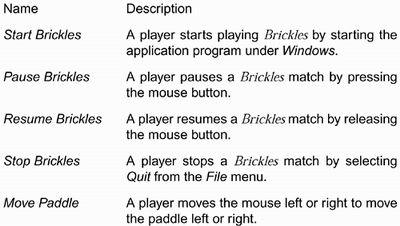
None of these use cases states how a player starts, pauses, resumes, or stops a match. In fact, none of them even mention Brickles explicitly. They can apply to many arcade games. They all have the same actor (a player) and are concerned with manipulating a match, which is an object (or class) we identified to represent an arcade game for which play is in progress.[14] As such, we might consider them domain-level use cases. These domain-level use cases can be refined for Brickles as shown in Figure 2.11.
Figure 2.11. Application-level use cases for Brickles
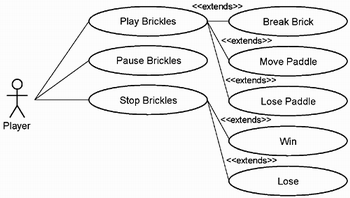
Use cases do not necessarily capture every requirement. The use cases are usually accompanied by additional text or diagrams that capture details (such as performance requirements) that are not immediately obvious to users and interfacing requirements for subsystems that are hidden from the user. Use cases are organized hierarchically using two relationships: uses and extends. You can refine some use cases into a set of more specific use cases. The first four use cases in Figure 2.11 are extended from the use cases in Figure 2.10. This structure helps to organize what can be a large number of cases. Locating a specific use case is accomplished by finding the high-level use case that covers the conceptual area of the specific case. The high-level use case then points to successively more specialized cases. Behavior common between two use cases can be grouped into a single "functional" use case. Each of the original use cases now has a uses relation with the common use case. In Brickles, the use cases of Breaking a Brick and Hitting a Wall would each have a uses relation with the Move Paddle use case. This simplifies maintenance by encapsulating details of common behavior. Use cases do not represent software. They represent requirements that software must meet. Consequently, you cannot test use cases; however, you can review them. Requirements play an important role in testing because they serve as the source of test cases in particular, system requirements give rise to test cases for system testing. In Chapter 4 we will show how to start with use cases to test the analysis and design models that represent the system. The test cases identified for testing models can be refined for execution-based testing of a running system, as we describe in Chapter 8. You can define one or more scenarios within the context of a use case. A scenario shows a particular application or instantiation of a use case. For example, the Move Paddle use case can give rise to scenarios:
These scenarios involve objects that have values for relevant attributes, such as defining which third of the paddle hits a puck [see Brickles Physics on page 11] and which general direction the puck is moving. By contrast, use cases involve objects without regard for values of attributes. Use cases are typically expressed using natural language, but use case diagrams can be used to depict all of a system's uses graphically. The diagram for the use cases in Figure 2.11 is shown in Figure 2.12. Figure 2.12. Use cases for Brickles
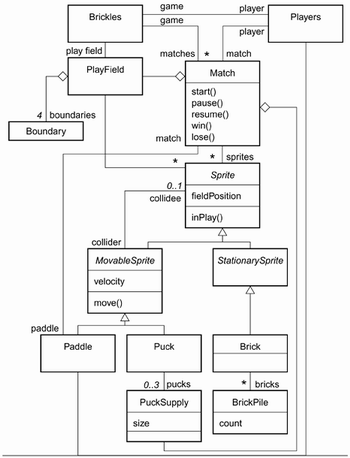
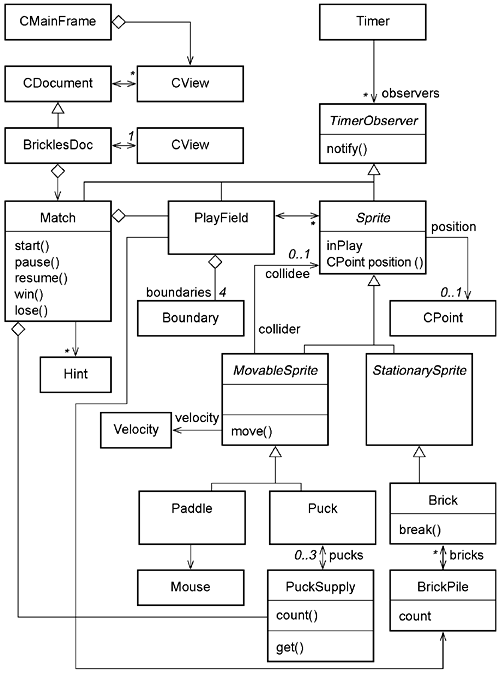
Class DiagramsA class diagram presents a static view of a set of classes and the relationships between the classes. The diagram can show operations and attributes for each class as well as constraints on relationships between objects. Figure 2.13 illustrates an analysis model for Brickles using UML. Figure 2.13. An application analysis class diagram for Brickles
You might expect to see a Mouse class in the diagram. We chose to omit it because the mouse is the mechanism by which a paddle can be moved. However, you could use any input pointing device, or even the arrow keys on a keyboard. We chose to make those considerations in design. Within this design, Sprite, MovableSprite, and StationarySprite are abstract classes indicated in the diagram by italicized names. A sprite is a graphical component of an arcade game.[15] A movable sprite is a sprite that can move around in a play field while a stationary sprite cannot move. A movable sprite can interact with other sprites for example, in Brickles a paddle hits a puck or a puck hits some bricks. These abstract classes originated from a domain analysis of arcade games and were incorporated into this model. When we started, we considered a possibility of implementing similar arcade games, so we took the time to identify abstractions. Even if we had not started with domain analysis, we likely would have noticed similar operations and attributes associated with pucks and paddles and bricks and ended up introducing these abstract classes anyway, even though we may not have used the term sprite, which is widely used by game implementers.
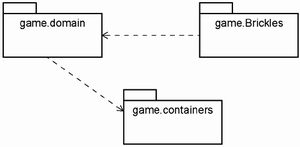
In practice, class diagrams can become quite large. Groups of classes can be represented as packages. Java has a direct package syntax while C++ uses a namespace syntax. Some people use UML package diagrams to identify packages and the dependencies among them. In Figure 2.14, the Brickles package diagram contains three packages. The domain classes are in the game.domain package so that they can easily be reused with another game in the future. The dashed arrow indicates that the Brickles specific-classes are dependent on the domain classes. The domain classes are also dependent on the container classes grouped into game.containers. Figure 2.14. Brickles package diagram
Diagrams such as class diagrams that describe classes, their features, and relationships play a central role in modeling. They reflect the structure of software and are a central focus of model testing (see Chapter 4). Testing associations can be challenging, especially in the presence of polymorphism, as in the association in Figure 2.13 between PlayField and Sprite or MovableSprite and Sprite. The most challenging aspects of associations are the topic of Chapter 6.
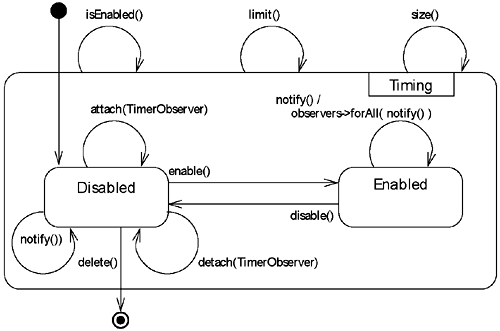
State DiagramsA state diagram describes the behavior of the objects in a class in terms of its observable states and how an object changes states as a result of events that affect the object. Two sample diagrams are shown in Figure 2.19. A state is a particular configuration of the values of data attributes. What is observable about the state is a difference in behavior from one state to another. That is, if the same message is sent to the object twice, it may behave differently depending on the state of the object when the message is received. A transition, or change, from one state to another is triggered by an event, which is typically a message arrival. A guard is a condition that must hold before the transition can be made. Guards are useful for representing transitions to various states based on a single event. An action specifies processing to be done while a transition is in progress. Each state may specify an activity to perform while an object is in that state. Figure 2.19. A state diagram for the class Timer
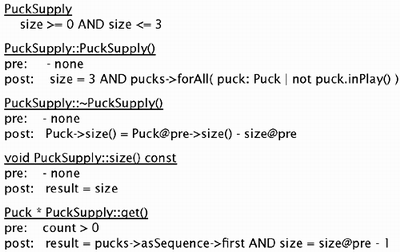
A Puck instance is either in play or not in play. If an instance is in play, then it is either moving or not moving. The observable state In Play of a puck has substates of Moving and Not Moving. In Play is a superstate; Moving and Not Moving are its substates. A substate inherits all the transitions entering and leaving its superstate. A concurrent state diagram can show groups of states that reflect the behavior of an object from the perspective of two or more independent ways. We will discuss the concurrent states in the Java implementation of Brickles later. Such diagrams can be treated from a testing perspective as a nonconcurrent state diagram by first defining states that are defined from all the combinations of the states from the various concurrent parts, and then defining the appropriate transitions. Class SpecificationsClass diagrams define classes and show attributes and operations associated with their instances. State diagrams illustrate the behavior of an instance of a class. However, neither diagram details the semantics associated with each operation. We use the Object Constraint Language (OCL) [WK99] for such specifications. OCL constraints are expressed in the context of a class diagram. Constraints involve attributes, operations, and associations that are defined in the diagram. As illustrated in the example shown in Figure 2.15, OCL expresses semantics of operations in terms of preconditions and post conditions. Invariant conditions can be prescribed for a class or interface and must hold at the time any operation is requested both in a message and upon the completion of the processing of the requested operation. (A method for an operation is allowed to temporarily violate an invariant during execution.) OCL conditions are Boolean-valued expressions and are tied to a class diagram. The constraints in Figure 2.15 use the size attribute of a puck supply and the zero-to-three navigable association of pucks shown in the design class diagram (see Figure 2.18). The pucks-> symbol in the constraint for the get() operation means to follow the pucks link to the set of associated objects. The use of the size attribute in a constraint in no way requires the implementation of the class to use a variable named size. It just means that the implementation will in some way need to represent that attribute, either as a variable or as an algorithm that computes the value based on other attributes. Specifications for operations should rarely ever prescribe an implementation. The syntax of OCL is too detailed for a summary box (see [WK99] for the language details). Figure 2.15. OCL for the operations of PuckSupply
Figure 2.18. A design class diagram for Brickles
You might prefer a more informal notation, such as the one in Figure 2.5. Some sort of good specification for each operation is needed for testing. If the developers have not generated such specifications, then we think testers should take the task upon themselves. It is virtually impossible to test code whose purpose is vague or ambiguous. It is virtually impossible to use code whose purpose is vague or ambiguous. Thus, not only will the existence of such specifications make testing easier, but their existence will improve the quality of the software and perhaps even promote the subsequent reuse of classes. Sequence DiagramsAn algorithm can be described as an interaction among objects. A sequence diagram captures the messaging between objects, object creation, and replies from messages.[16] In analysis, sequence diagrams illustrate process in the domain how common tasks are usually carried out through the interaction of various objects in a scenario. A sample sequence diagram is shown in Figure 2.16. Within a sequence diagram, an object is represented by a box and its lifeline is represented by a dashed line that extends downward. The passing of time is reflected down the page. Objects drawn at the top of the diagram exist at the start of processing. Objects drawn farther down are created at that point. A message is represented by an arrow with a filled-in arrowhead. A reply value is represented by an arrow with an open arrowhead. A widening of a lifeline reflects an activation in which one of the object's operations is involved in the current sequence.
Figure 2.16. A sequence diagram for Brickles
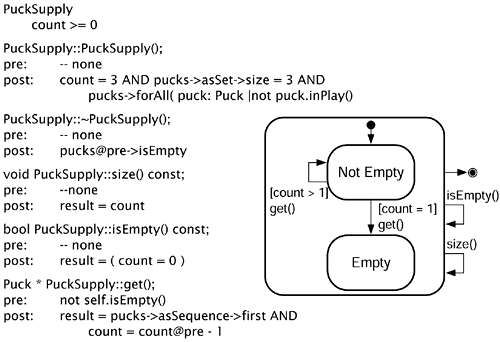
A sequence diagram may be created at any level of abstraction. A scenario for a use case can be represented by a sequence diagram. The algorithm for a single method in a class may also be represented using this notation. Figure 2.16 shows a sequence diagram for winning a match in Brickles. Sequence diagrams can also represent concurrency. An asynchronous message is indicated by a half arrowhead ( Tip Define accessor operations that provide the observable state of a receiver. The OCL specification in Figure 2.15 conveys the same state information as the diagram for PuckSupply below. The OCL specification is more complete, but the state diagram is easier to understand for most people. Some of the preconditions for operators are implicit in the state diagram, while state definitions are implicit in the OCL specification. For example, within the context of the state diagram, the get() operation is permitted only when a puck supply object is in a Not Empty state since no transition from the Empty state is labeled with a get() event. This precondition is expressed in the OCL specification as a constraint on the count attribute associated with a PuckSupply, with no mention of a Not Empty state. We prefer to design classes so that states are represented explicitly in a class's interface. This makes the specification more intuitive, thereby making the checking of preconditions by senders a little easier and more reliable, thus making testing a little easier. For PuckSupply, we would add the Boolean-valued query operation isEmpty() to the interface and express preconditions in terms of this state-querying operation. A revised OCL specification for PuckSupply is
Of course, the state diagram must be updated to reflect the new operation. Accessor operations that return state information make testing a little easier (see Chapter 5) and can also make checking preconditions possible. The inclusion of such operations in a class interface is an example of designing for testing.
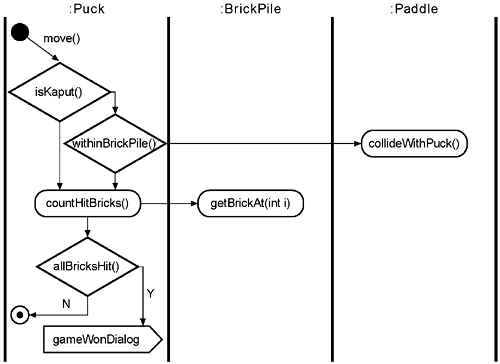
Activity DiagramsSequence diagrams capture single traces through a set of object interactions. It is difficult if not impossible to represent iteration and concurrency. The activity diagram provides a more comprehensive representation that uses a combination of flowchart and petri net notations. The activity diagram in Figure 2.17 is from the move() method in Puck. Figure 2.17. Activity diagram for the move() method in Puck
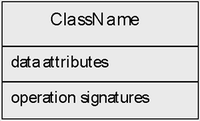
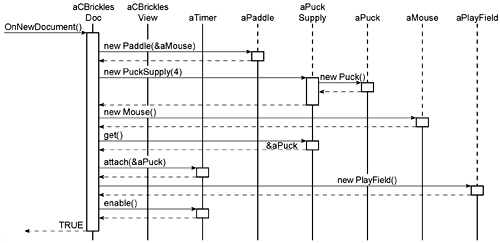
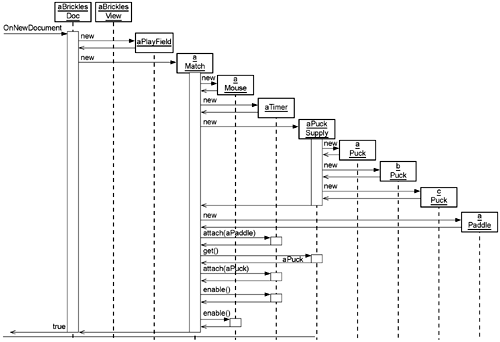
Design ModelsA design model represents how the software meets requirements. A major strength of the object-oriented development paradigm is that design models are refinements and extensions of the analysis models. That is good news from a testing perspective because it means that we can reuse and extend test cases developed for analysis models. Many of the same kinds of diagrams are used in design, but with an emphasis on the solution rather than the problem. Consequently, the diagrams reflect solution-level objects as well as problem-level objects. Since the notation is the same as we have already described, we will focus on the meaning of the design information represented. Class DiagramsClass diagrams are used in design to depict the kinds of objects that will be created by the software. Each class has a name, attributes, and operations as well as relationships with other classes shown on a diagram. In a design-class diagram, we expect to see most of the classes and relationships in the analysis class diagram as well as classes whose instances will help solve the problem. Some analysis classes will disappear because they have no role in a solution. Others will most likely have additional attributes and relationships introduced for them with solution-level classes and objects. The crux of good object-oriented design is reflected in a class diagram that maintains most of the structure of the problem (as reflected in the analysis class diagram), and then augments the software versions of the objects in the problem to collaborate to bring about a solution. A class diagram for the design of Brickles is shown in Figure 2.18. Note the introduction of implementation-level classes such as Mouse, which represents a mouse attached to the computer, and Hint, which represents an object needed to track events during an execution that results in a need to repair the contents of the screen. This diagram also shows some of the classes in the Microsoft Foundation Classes (MFC) [MFC], such as CMainFrame, CView, and CDocument, which invoke Brickles in a Windows environment as set forth in the requirements. The open arrowheads on some of the associations indicate navigability that is, the directions in which associations are actually to be implemented. An association can be bidirectional or unidirectional. Arrows indicate which objects know about a certain relationship. We seldom indicate navigability in an analysis class diagram, but find them most useful in design class diagrams. In sequence diagrams, messaging between objects can occur only in the direction of a navigable association. State DiagramsThe state diagrams used in design are the same as those in analysis. The major difference would be state diagrams for new classes in the design class diagram and, potentially, new substates that might aid implementation. Design diagrams might also incorporate more actions associated with transitions and more activities associated with states. In Brickles, some mechanism is needed to control the movement of the puck and the paddle. We chose to use timer events provided by Windows with MFC to make the execution independent of the processor speed. Consequently, we introduced a design class, Timer (see Figure 2.18), which processes timer events and manipulates appropriate sprites in a match. A state diagram for the class Timer is shown in Figure 2.19. A timer maintains a list of observers that is, the objects interested in being notified each time a timer event arrives. When a timer is enabled, it notifies each of its attached observers that a timer event has occurred with a notify() message. TimerObserver is an abstract class (see Figure 2.18) that represents observers. Inclusion polymorphism allows an instance of any subclass of TimerObserver to be attached and, hence, notified. This part of the implementation is based on the Observer design pattern [GHJV94]. From a testing perspective, we will want to ensure the test cases for a class that adequately tests transitions between states and provides for the proper processing of messages within each state. We might also want to check that the Observer pattern is correctly incorporated into the design of Timer and TimerObserver. It might even be possible to reuse some test cases and test drivers that were developed for testing other classes whose design is based on the same pattern. Sequence DiagramsSequence diagrams are used in design to describe algorithms that is, what objects are involved in the processing of some aspect of the solution and how those objects interact to affect that processing. The main distinction from their use in analysis is the presence of solution-level objects in the design diagrams. A sequence diagram for the start-up processing associated with Brickles is shown in Figure 2.20. This represents an algorithm for creating the objects needed to get a match underway. From a testing perspective, possible errors include violation of contracts, failure to create objects of the correct class, and sending of messages for which no navigability is indicated between sender and receiver on the class diagram. Figure 2.20. A sequence diagram for the start-up of a Brickles match
Source CodeSource code and source code documentation are the final representations of the software. A translator (a compiler or interpreter) makes source code executable. The source code is expected to be an accurate translation of the detailed design models into a programming language, although we certainly must test for that. For object-oriented systems, the code contains class definitions and a segment that creates instances of some class(es) and gets processing started for example, the main() function in C++ or a static method main() in Java. Each class uses instances of other classes to provide parts of its implementation. These instances, along with the parameters to messages, make up most of the relationships among objects. Testing actual code has been the principal concern of most traditional testing efforts and is the focus of most chapters in this book. Source code can be tested as it is developed, component by component, or as a completed product at the end of development. The major issues to be addressed are:
These will be addressed in detail in association with planning for testing in Chapter 3.
|
EAN: 2147483647
Pages: 126
