Section 2.12. CPU Statistics Internals
2.12. CPU Statistics InternalsThe following is a brief reference for how some of the CPU statistics are maintained by the kernel. 2.12.1. usr, sys, idl TimesThe percent user, system and idle times printed by vmstat, sar, and mpstat are retrieved from kstat statistics. These statistics are updated by CPU microstate counters, which are kept in each CPU struct as cpu->cpu_acct[NCMSTATES]; these measure cumulative time in each CPU microstate as high-resolution time counters (HRtime_t). There are three CPU microstates, CMS_USER, CMS_SYSTEM, and CMS_IDLE (there is also a fourth, CMS_DISABLED, which isn't used for microstate accounting). These per CPU microstate counters are incremented by functions such as new_cpu_mstate() and syscall_mstate() from uts/common/os/msacct.c. When the CPU state changes, a timestamp is saved in cpu->cpu_mstate_start and the new state is saved in cpu->cpu_mstate. When the CPU state changes next, the current time is fetched (curtime) so that the elapsed time in that state can be calculated with curtime - cpu_mstate_start and then added to the appropriate microstate counter in cpu_acct[]. These microstates are then saved in kstat for each CPU as part of the cpu_sys_stats_ks_data struct defined in uts/common/os/cpu.c and are given the names cpu_nsec_user, cpu_nsec_kernel, and cpu_nsec_idle. Since user-land code expects these counters to be in terms of clock ticks, they are rounded down using NSEC_TO_TICK (see Section 2.8), and resaved in kstat with the names cpu_ticks_user, cpu_ticks_kernel, and cpu_ticks_idle. Figure 2.1 summarizes the flow of data from the CPU structures to userland tools through kstat Figure 2.1. CPU Statistic Data Flow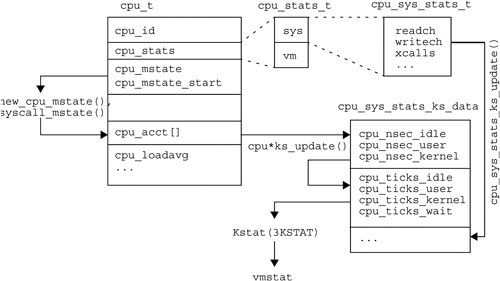 This is the code from cpu.c which copies the cpu_acct[] values to kstat. static int cpu_sys_stats_ks_update(kstat_t *ksp, int rw) { .. css = &cp->cpu_stats.sys; bcopy(&cpu_sys_stats_ks_data_template, ksp->ks_data, sizeof (cpu_sys_stats_ks_data_template)); csskd->cpu_ticks_wait.value.ui64 = 0; csskd->wait_ticks_io.value.ui64 = 0; csskd->cpu_nsec_idle.value.ui64 = cp->cpu_acct[CMS_IDLE]; csskd->cpu_nsec_user.value.ui64 = cp->cpu_acct[CMS_USER]; csskd->cpu_nsec_kernel.value.ui64 = cp->cpu_acct[CMS_SYSTEM]; ... Note that cpu_ticks_wait is set to zero; this is the point in the code where wait I/O has been deprecated. An older location for tick-based statistics is cpu->cpu_stats.sys, which is of cpu_sys_stats_t. These are defined in /usr/include/sys/sysinfo.h, where original tick counters of the style cpu_ticks_user are listed. The remaining statistics from cpu->cpu_stats.sys (for example, readch, writech) are copied directly into kstat's cpu_sys_stats_ks_data. Tools such as vmstat fetch the tick counters from kstat, which provides them under cpu:#:sys: for each CPU. Although these counters use the term "ticks," they are extremely accurate because they are rounded versions of the nsec counters; which are copied from the CPU microstate counters. The mpstat command prints individual CPU statistics (Section 2.9) and the vmstat command aggregates statistics across all CPUs (Section 2.2). 2.12.2. Load AveragesThe load averages that tools such as uptime print are retrieved using system call getloadavg(), which returns them from the kernel array of signed ints called avenrun[]. They are actually maintained in a high precision uint64_t array called hp_avenrun[], and then converted to avenrun[] to meet the original API. The code that maintains these arrays is in the clock() function from uts/common/os/clock.c, and is run once per second. It involves the following. The loadavg_update() function is called to add user + system + thread wait (latency) microstate accounting times together. This value is stored in an array within a struct loadavg_s, one of which exists for each CPU, each CPU partition, and for the entire system. These arrays contain the last ten seconds of raw data. Then genloadavg() is called to process both CPU partition and the system wide arrays, and return the average for the last ten seconds. This value is fed to calcloadavg(), which applies exponential decays for the 1-, 5-, 15-minute values, saving the results in hp_avenrun[] or cp_hp_avenrun[] for the CPU partitions. hp_avenrun[] is then converted into avenrun[]. This means that these load averages are damped more than once. First through a rolling ten second average, and then through exponential decays. Apart from the getloadavg() syscall, they are also available from kstat where they are called avenrun_1min, avenrun_5min, avenrun_15min. Running kstat -s avenrun\* prints the raw unprocessed values, which must be divided by FSCALE to produce the final load averages. 2.12.3. pr_pctcpu FieldThe CPU field that prstat prints is pr_pctcpu, which is fetched by user-level tools from procfs. It is maintained for each thread as thread->t_pctcpu by the cpu_update_pct() function in common/os/msacct.c. This takes a high-resolution timestamp and calculates the elapsed time since the last measurement, which was stored in each thread's t_hrtime. cpu_update_pct() is called by scheduling events, producing an extremely accurate measurement as this is based on events and not ticks. cpu_update_pct() is also called by procfs when a pr_pctcpu value is read, at which point every thread's t_pctcpu is aggregated into pr_pctcpu. The cpu_update_pct() function processes t_pctcpu as a decayed average by using two other functions: cpu_grow() and cpu_decay(). The way this behaves may be quite familiar: If a CPU-bound process begins, the reported CPU value is not immediately 100%; instead it increases quickly at first and then slows down, gradually reaching 100. The algorithm has the following comment above the cpu_decay() function. /* * Given the old percent cpu and a time delta in nanoseconds, * return the new decayed percent cpu: pct * exp(-tau), * where 'tau' is the time delta multiplied by a decay factor. * We have chosen the decay factor (cpu_decay_factor in param.c) * to make the decay over five seconds be approximately 20%. * ... This comment explains that the rate of t_pctcpu change should be 20% for every five seconds (and the same for pr_pctcpu). User-level commands read pr_pctcpu by reading /proc/<pid>/psinfo for each process, which contains pr_pctcpu in a psinfo struct as defined in /usr/ include/sys/procfs.h. |
EAN: 2147483647
Pages: 180
- Step 2.1 Use the OpenSSH Tool Suite to Replace Clear-Text Programs
- Step 3.2 Use PuTTY / plink as a Command Line Replacement for telnet / rlogin
- Step 3.3 Use WinSCP as a Graphical Replacement for FTP and RCP
- Step 4.5 How to use OpenSSH Passphrase Agents
- Step 5.2 Troubleshooting Common OpenSSH Errors/Problems