Section 14.1. Working with Kernel Cores
14.1. Working with Kernel CoresThe most common type of kernel debug target is a core file, saved from a prior system crash. In the following sections, we highlight some of the introductory steps as used with mdb to explore a kernel core image. 14.1.1. Locating and Attaching the TargetIf a system has crashed, then we should have a core image saved in /var/crash on the target machine. The mdb debugger should be invoked from a system with the same architecture and Solaris revision as the crash image. The first steps are to locate the appropriate saved image and then to invoke mdb. # cd /var/crash/nodename # ls bounds unix.1 unix.3 unix.5 unix.7 vmcore.1 vmcore.3 vmcore.5 vmcore.7 unix.0 unix.2 unix.4 unix.6 vmcore.0 vmcore.2 vmcore.4 vmcore.6 # mdb -k unix.7 vmcore.7 Loading modules: [ unix krtld$c genunix specfs dtrace ufs ip sctp usba uhci s1394 fcp fctl nca lofs zfs random nfs audiosup sppp crypto md fcip logindmux ptm ipc ] > 14.1.2. Examining Kernel Core Summary InformationThe kernel core contains important summary information from which we can extract the following:
We can use the ::showrev and ::status dcmds to extract this information. > ::showrev Hostname: zones-internal Release: 5.11 Kernel architecture: i86pc Application architecture: i386 Kernel version: SunOS 5.11 i86pc snv_27 Platform: i86pc > ::status debugging crash dump vmcore.2 (32-bit) from zones-internal operating system: 5.11 snv_27 (i86pc) panic message: BAD TRAP: type=e (#pf Page fault) rp=d2a587c8 addr=0 occurred in module "unix" due to a NULL pointer dereference dump content: kernel pages only > ::panicinfo cpu 0 thread d2a58de0 message BAD TRAP: type=e (#pf Page fault) rp=d2a587c8 addr=0 occurred in module "unix" due to a NULL pointer dereference gs fe8301b0 fs fec30000 es fe8d0160 ds d9820160 edi 0 esi dc062298 ebp d2a58828 esp d2a58800 ebx de453000 edx d2a58de0 ecx 1 eax 0 trapno e err 2 eip fe82ca58 cs 158 eflags 10282 uesp fe89ab0d ss 0 gdt fec1f2f002cf idt fec1f5c007ff ldt 140 task 150 cr0 8005003b cr2 0 cr3 4cb3000 cr4 6d8 14.1.3. Examining the Message BufferThe kernel keeps a cyclic buffer of the recent kernel messages. In this buffer we can observe the messages up to the time of the panic. The ::msgbuf dcmd shows the contents of the buffer. > ::msgbuf MESSAGE /pseudo/zconsnex@1/zcons@5 (zcons5) online /pseudo/zconsnex@1/zcons@6 (zcons6) online /pseudo/zconsnex@1/zcons@7 (zcons7) online pseudo-device: ramdisk1024 ... panic[cpu0]/thread=d2a58de0: BAD TRAP: type=e (#pf Page fault) rp=d2a587c8 addr=0 occurred in module "unix" due to a NULL pointer dereference sched: #pf Page fault Bad kernel fault at addr=0x0 pid=0, pc=0xfe82ca58, sp=0xfe89ab0d, eflags=0x10282 cr0: 8005003b<pg,wp,ne,et,ts,mp,pe> cr4: 6d8<xmme,fxsr,pge,mce,pse,de> cr2: 0 cr3: 4cb3000 gs: fe8301b0 fs: fec30000 es: fe8d0160 ds: d9820160 edi: 0 esi: dc062298 ebp: d2a58828 esp: d2a58800 ebx: de453000 edx: d2a58de0 ecx: 1 eax: 0 trp: e err: 2 eip: fe82ca58 cs: 158 efl: 10282 usp: fe89ab0d ss: 0 ... 14.1.4. Obtaining a Stack Trace of the Running ThreadWe can obtain a stack backtrace of the current thread by using the $C command. Note that the displayed arguments to each function are not necessarily accurate. On each platform, the meaning of the shown arguments is as follows:
> $C d2a58828 atomic_add_32+8(0) d2a58854 nfs4_async_inactive+0x3b(dc1c29c0, 0) d2a58880 nfs4_inactive+0x41() d2a5889c fop_inactive+0x15(dc1c29c0, 0) d2a588b0 vn_rele+0x4b(dc1c29c0) d2a588c0 snf_smap_desbfree+0x59(dda94080) d2a588dc dblk_lastfree_desb+0x13(de45b520, d826fb40) d2a588f4 dblk_decref+0x4e(de45b520, d826fb40) d2a58918 freemsg+0x69(de45b520) d2a5893c FreeTxSwPacket+0x3b(d38b84f0) d2a58968 CleanTxInterrupts+0xb4(d2f9cac0) d2a589a4 e1000g_send+0xf6(d2f9cac0, d9ffba00) d2a589c0 e1000g_m_tx+0x22() d2a589dc dls_tx+0x16(d4520f68, d9ffba00) d2a589f4 str_mdata_fastpath_put+0x1e(d3843f20, d9ffba00) d2a58a40 tcp_send_data+0x62d(db0ecac0, d97ee250, d9ffba00) d2a58aac tcp_send+0x6b6(d97ee250, db0ecac0, 564, 28, 14, 0) d2a58b40 tcp_wput_data+0x622(db0ecac0, 0, 0) d2a58c28 tcp_rput_data+0x2560(db0ec980, db15bd20, d2d45f40) d2a58c40 tcp_input+0x3c(db0ec980, db15bd20, d2d45f40) d2a58c78 squeue_enter_chain+0xe9(d2d45f40, db15bd20, db15bd20, 1, 1) d2a58cec ip_input+0x658(d990e554, d3164010, 0, e) d2a58d40 i_dls_link_ether_rx+0x156(d4523db8, d3164010, db15bd20) d2a58d70 mac_rx+0x56(d3520200, d3164010, db15bd20) d2a58dac e1000g_intr+0xa6(d2f9cac0, 0) d2a58ddc intr_thread+0x122() 14.1.5. Which Process?If the stack trace is of a kernel housekeeping or interrupt thread, the process reported for the thread will be that of p0"sched." The process pointer for the thread can be obtained with ::tHRead, and ::ps will then display summary information about that process. In this example, the thread is an interrupt thread (as indicated by the top entry in the stack from $C), and the process name maps to sched. > d2a58de0::thread -p ADDR PROC LWP CRED d2a58de0 fec1d280 0 d9d1cf38 > fec1d280::ps -t S PID PPID PGID SID UID FLAGS ADDR NAME R 0 0 0 0 0 0x00000001 fec1d280 sched T t0 <TS_STOPPED> 14.1.6. Disassembling the Suspect CodeOnce we've located the thread of interest, we often learn more about what happened by disassembling the target and looking at the instruction that reportedly caused the panic. MDB's ::dis dcmd will disassemble the code around the target instruction that we extract from the stack backtrace. > $C d2a58828 atomic_add_32+8(0) d2a58854 nfs4_async_inactive+0x3b(dc1c29c0, 0) d2a58880 nfs4_inactive+0x41() d2a5889c fop_inactive+0x15(dc1c29c0, 0) d2a588b0 vn_rele+0x4b(dc1c29c0) ... > nfs4_async_inactive+0x3b::dis nfs4_async_inactive+0x1a: pushl $0x28 nfs4_async_inactive+0x1c: call +0x51faa30 <kmem_alloc> nfs4_async_inactive+0x21: addl $0x8,%esp nfs4_async_inactive+0x24: movl %eax,%esi nfs4_async_inactive+0x26: movl $0x0,(%esi) nfs4_async_inactive+0x2c: movl -0x4(%ebp),%eax nfs4_async_inactive+0x2f: movl %eax,0x4(%esi) nfs4_async_inactive+0x32: movl 0xc(%ebp),%edi nfs4_async_inactive+0x35: pushl %edi nfs4_async_inactive+0x36: call +0x51b7cdc <crhold> nfs4_async_inactive+0x3b: addl $0x4,%esp nfs4_async_inactive+0x3e: movl %edi,0x8(%esi) nfs4_async_inactive+0x41: movl $0x4,0xc(%esi) nfs4_async_inactive+0x48: leal 0xe0(%ebx),%eax nfs4_async_inactive+0x4e: movl %eax,-0x8(%ebp) nfs4_async_inactive+0x51: pushl %eax nfs4_async_inactive+0x52: call +0x51477f4 <mutex_enter> nfs4_async_inactive+0x57: addl $0x4,%esp nfs4_async_inactive+0x5a: cmpl $0x0,0xd4(%ebx) nfs4_async_inactive+0x61: je +0x7e <nfs4_async_inactive+0xdf> nfs4_async_inactive+0x63: cmpl $0x0,0xd0(%ebx) > crhold::dis crhold: pushl %ebp crhold+1: movl %esp,%ebp crhold+3: andl $0xfffffff0,%esp crhold+6: pushl $0x1 crhold+8: movl 0x8(%ebp),%eax crhold+0xb: pushl %eax crhold+0xc: call -0x6e0b8 <atomic_add_32> crhold+0x11: movl %ebp,%esp crhold+0x13: popl %ebp crhold+0x14: ret > atomic_add_32::dis atomic_add_32: movl 0x4(%esp),%eax atomic_add_32+4: movl 0x8(%esp),%ecx atomic_add_32+8: lock addl %ecx,(%eax) atomic_add_32+0xb: ret 14.1.7. Displaying General-Purpose RegistersIn this example, the system had a NULL pointer reference at atomic_add_ 32+8(0). The faulting instruction was atomic, referencing the memory at the location pointed to by %eax. By looking at the registers at the time of the panic, we can see that %eax was indeed NULL. The next step is to attempt to find out why %eax was NULL. > ::regs %cs = 0x0158 %eax = 0x00000000 %ds = 0xd9820160 %ebx = 0xde453000 %ss = 0x0000 %ecx = 0x00000001 %es = 0xfe8d0160 %edx = 0xd2a58de0 %fs = 0xfec30000 %esi = 0xdc062298 %gs = 0xfe8301b0 %edi = 0x00000000 %eip = 0xfe82ca58 atomic_add_32+8 %ebp = 0xd2a58828 %esp = 0xd2a58800 %eflags = 0x00010282 id=0 vip=0 vif=0 ac=0 vm=0 rf=1 nt=0 iopl=0x0 status=<of,df,IF,tf,SF,zf,af,pf,cf> %uesp = 0xfe89ab0d %trapno = 0xe %err = 0x2 14.1.8. Navigating the Stack BacktraceThe function prototype for atomic_add_32() reveals that the first argument is a pointer to the memory location to be added. Since this was an x86 machine, the arguments reported by the stack backtrace are known to be useful, and we can look to see where the NULL pointer was handed downin this case nfs4_async_inactive(). void atomic_add_32(volatile uint32_t *target, int32_t delta) { *target += delta; } > atomic_add_32::dis atomic_add_32: movl 0x4(%esp),%eax atomic_add_32+4: movl 0x8(%esp),%ecx atomic_add_32+8: lock addl %ecx,(%eax) atomic_add_32+0xb: ret > $C d2a58828 atomic_add_32+8(0) d2a58854 nfs4_async_inactive+0x3b(dc1c29c0, 0) d2a58880 nfs4_inactive+0x41() d2a5889c fop_inactive+0x15(dc1c29c0, 0) d2a588b0 vn_rele+0x4b(dc1c29c0) ... > $C d2a58828 atomic_add_32+8(0) d2a58854 nfs4_async_inactive+0x3b(dc1c29c0, 0) d2a58880 nfs4_inactive+0x41() d2a5889c fop_inactive+0x15(dc1c29c0, 0) d2a588b0 vn_rele+0x4b(dc1c29c0) ... > nfs4_async_inactive+0x3b::dis nfs4_async_inactive+0x1a: pushl $0x28 nfs4_async_inactive+0x1c: call +0x51faa30 <kmem_alloc> nfs4_async_inactive+0x21: addl $0x8,%esp nfs4_async_inactive+0x24: movl %eax,%esi nfs4_async_inactive+0x26: movl $0x0,(%esi) nfs4_async_inactive+0x2c: movl -0x4(%ebp),%eax nfs4_async_inactive+0x2f: movl %eax,0x4(%esi) nfs4_async_inactive+0x32: movl 0xc(%ebp),%edi nfs4_async_inactive+0x35: pushl %edi nfs4_async_inactive+0x36: call +0x51b7cdc <crhold> nfs4_async_inactive+0x3b: addl $0x4,%esp nfs4_async_inactive+0x3e: movl %edi,0x8(%esi) nfs4_async_inactive+0x41: movl $0x4,0xc(%esi) nfs4_async_inactive+0x48: leal 0xe0(%ebx),%eax nfs4_async_inactive+0x4e: movl %eax,-0x8(%ebp) nfs4_async_inactive+0x51: pushl %eax nfs4_async_inactive+0x52: call +0x51477f4 <mutex_enter> nfs4_async_inactive+0x57: addl $0x4,%esp nfs4_async_inactive+0x5a: cmpl $0x0,0xd4(%ebx) nfs4_async_inactive+0x61: je +0x7e <nfs4_async_inactive+0xdf> nfs4_async_inactive+0x63: cmpl $0x0,0xd0(%ebx) ... Looking at the disassembly, it appears that there is an additional function call, which is omitted from the stack backtrack (typically due to tail call compiler optimization). The call is to crhold(), passing the address of a credential structure from the arguments to nfs4_async_inactive(). Here we can see that crhold() does in fact call atomic_add_32(). /* * Put a hold on a cred structure. */ void crhold(cred_t *cr) { atomic_add_32(&cr->cr_ref, 1); } > crhold::dis crhold: pushl %ebp crhold+1: movl %esp,%ebp crhold+3: andl $0xfffffff0,%esp crhold+6: pushl $0x1 crhold+8: movl 0x8(%ebp),%eax crhold+0xb: pushl %eax crhold+0xc: call -0x6e0b8 <atomic_add_32> crhold+0x11: movl %ebp,%esp crhold+0x13: popl %ebp crhold+0x14: ret Next, we look into the situation in which nfs4_async_inactive() was called. The first argument is a vnode pointer, and the second is our suspicious credential pointer. The vnode pointer can be examined with the CTF information and the ::print dcmd. We can see that we were performing an nfs4_async_inactive function on the vnode referencing a pdf file in this case. */ void nfs4_async_inactive(vnode_t *vp, cred_t *cr) { > $C d2a58828 atomic_add_32+8(0) d2a58854 nfs4_async_inactive+0x3b(dc1c29c0, 0) > dc1c29c0::print vnode_t { ... v_type = 1 (VREG) v_rdev = 0 ... v_path = 0xdc3de800 "/zones/si/root/home/ftp/book/solarisinternals_projtaskipc.pdf" ... } Looking further at the stack backtrace and the code, we can try to identify where the credentials were derived from. nfs4_async_inactive() was called by nfs4_inactive(), which is one of the standard VOP methods (VOP_INACTIVE). > $C d2a58828 atomic_add_32+8(0) d2a58854 nfs4_async_inactive+0x3b(dc1c29c0, 0) d2a58880 nfs4_inactive+0x41() d2a5889c fop_inactive+0x15(dc1c29c0, 0) d2a588b0 vn_rele+0x4b(dc1c29c0) The credential can be followed all the way up to vn_rele(), which derives the pointer from CRED(), which references the current thread's t_cred. vn_rele(vnode_t *vp) { if (vp->v_count == 0) cmn_err(CE_PANIC, "vn_rele: vnode ref count 0"); mutex_enter(&vp->v_lock); if (vp->v_count == 1) { mutex_exit(&vp->v_lock); VOP_INACTIVE(vp, CRED()); ... #define CRED() curthread->t_cred We know which thread called vn_rele()the interrupt thread with a thread pointer of d2a58de0. We can use ::print to take a look at the thread's t_cred. > d2a58de0::print kthread_t t_cred t_cred = 0xd9d1cf38 Interestingly, it's not NULL! A further look around the code gives us some clues as to what's going on. In the initialization code during the creation of an interrupt thread, the t_cred is set to NULL: /* * Create and initialize an interrupt thread. * Returns non-zero on error. * Called at spl7() or better. */ void thread_create_intr(struct cpu *cp) { ... /* * Nobody should ever reference the credentials of an interrupt * thread so make it NULL to catch any such references. */ tp->t_cred = NULL; Our curthread->t_cred is not NULL, but NULL was passed in when CRED() accessed it in the not-too-distant pastan interesting situation indeed. It turns out that the NFS client code wills credentials to the interrupt thread's t_cred, so what we are in fact seeing is a race condition, where vn_rele() is called from the interrupt thread with no credentials. In this case, a bug was logged accordingly and the problem was fixed! 14.1.9. Looking at the Status of the CPUsAnother good source of information is the ::cpuinfo dcmd. It shows a rich set of information of the processors in the system. For each CPU, the details of the thread currently running on each processor are shown. If the current CPU is handling an interrupt, then the thread running the interrupt and the preempted thread are shown. In addition, a list of threads waiting in the run queue for this processor is shown. 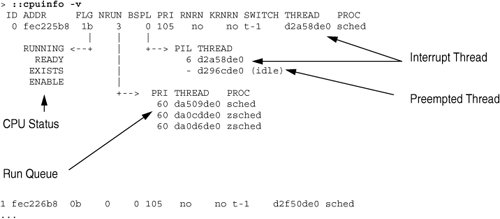 In this example, we can see that the idle thread was preempted by a level 6 interrupt. Three threads are on the run queue: the thread that was running immediately before preemption and two other threads waiting to be scheduled on the run queue. We can traverse these manually, by traversing the stack of the thread pointer with ::findstack. > :da509de0:findstack stack pointer for thread da509de0: da509d08 da509d3c swtch+0x165() da509d60 cv_timedwait+0xa3() da509dc8 taskq_d_thread+0x149() da509dd8 thread_start+8() The CPU containing the thread that caused the panic will, we hope, be reported in the panic string and, furthermore, will be used by MDB as the default thread for other dcmds in the core image. Once we determine the status of the CPU, we can observe which thread was involved in the panic. Additionally, we can use the CPU's run queue (cpu_dispq) to provide a stack list for other threads queued up to run. We might do this just to gather a little more information about the circumstance in which the panic occurred. > fec225b8::walk cpu_dispq |::thread ADDR STATE FLG PFLG SFLG PRI EPRI PIL INTR DISPTIME BOUND PR da509de0 run 8 0 13 60 0 0 n/a 7e6f9c -1 0 da0cdde0 run 8 2000 13 60 0 0 n/a 7e8452 -1 0 da0d6de0 run 8 2000 13 60 0 0 n/a 7e8452 -1 0 > fec225b8::walk cpu_dispq |::findstack stack pointer for thread da509de0: da509d08 da509d3c swtch+0x165() da509d60 cv_timedwait+0xa3() da509dc8 taskq_d_thread+0x149() da509dd8 thread_start+8() stack pointer for thread da0cdde0: da0cdd48 da0cdd74 swtch+0x165() da0cdd84 cv_wait+0x4e() da0cddc8 nfs4_async_manager+0xc9() da0cddd8 thread_start+8() stack pointer for thread da0d6de0: da0d6d48 da0d6d74 swtch+0x165() da0d6d84 cv_wait+0x4e() da0d6dc8 nfs4_async_manager+0xc9() da0d6dd8 thread_start+8() 14.1.10. Traversing Stack Frames in SPARC ArchitecturesWe briefly mentioned in Section 14.1.4 some of the problems we encounter when trying to glean argument values from stack backtraces. In the SPARC architecture, the values of the input arguments' registers are saved into register windows at the exit of each function. In most cases, we can traverse the stack frames to look at the values of the registers as they are saved in register windows. Historically, this was done by manually traversing the stack frames (as illustrated in Panic!). Conveniently, MDB has a dcmd that understands and walks SPARC stack frames. We can use the ::stackregs dcmd to display the SPARC input registers and locals (%l0-%l7) for each frame on the stack. > ::stackregs 000002a100d074c1 vpanic(12871f0, e, e, fffffffffffffffe, 1, 185d400) %l0-%l3: 0 2a100d07f10 2a100d07f40 ffffffff %l4-%l7: fffffffffffffffe 0 1845400 1287000 px_err_fabric_intr+0xbc: call -0x1946c0 <fm_panic> 000002a100d07571 px_err_fabric_intr+0xbc(600024f9880, 31, 340, 600024d75d0, 30000842020, 0) %l0-%l3: 0 2a100d07f10 2a100d07f40 ffffffff %l4-%l7: fffffffffffffffe 0 1845400 1287000 px_msiq_intr+0x1ac: call -0x13b0 <px_err_fabric_intr> 000002a100d07651 px_msiq_intr+0x1ac(60002551db8, 0, 127dcc8, 6000252e9e0, 30000828a58, 30000842020) %l0-%l3: 0 2a100d07f10 2a100d07f40 2a100d07f10 %l4-%l7: 0 31 30000842020 600024d21d8 current_thread+0x174: jmpl %o5, %o7 000002a100d07751 current_thread+0x174(16, 2000, ddf7dfff, ddf7ffff, 2000, 12) %l0-%l3: 100994c 2a100cdf021 e 7b9 %l4-%l7: 0 0 0 2a100cdf8d0 cpu_halt+0x134: call -0x29dcc <enable_vec_intr> 000002a100cdf171 cpu_halt+0x134(16, d, 184bbd0, 30001334000, 16, 1) %l0-%l3: 60001db16c8 0 60001db16c8 ffffffffffffffff %l4-%l7: 0 0 0 10371d0 idle+0x124: jmpl %l7, %o7 000002a100cdf221 idle+0x124(1819800, 0, 30001334000, ffffffffffffffff, e, 1818400) %l0-%l3: 60001db16c8 1b 0 ffffffffffffffff %l4-%l7: 0 0 0 10371d0 thread_start+4: jmpl %i7, %o7 000002a100cdf2d1 thread_start+4(0, 0, 0, 0, 0, 0) %l0-%l3: 0 0 0 0 %l4-%l7: 0 0 0 0 SPARC input registers become output registers, which are then saved on the stack. The common technique when trying to qualify registers as valid arguments is to ascertain, before the registers are saved in the stack frame, whether they have been overwritten during the function. A common technique is to disassemble the target function, looking to see if the input registers (%i0-%i7) are reused in the function's code body. A quick and dirty way to look for register usage is to use ::dis piped to a UNIX grep; however, at this stage, examining the code for use of input registers is left as an exercise for the reader. For example, if we are looking to see if the values of the first argument to cpu_halt() are valid, we could see if %i0 is reused during the cpu_halt() function, before we branch out at cpu_halt+0x134. > cpu_halt::dis !grep i0 cpu_halt+0x24: ld [%g1 + 0x394], %i0 cpu_halt+0x28: cmp %i0, 1 cpu_halt+0x90: add %i2, 0x120, %i0 cpu_halt+0xd0: srl %i4, 0, %i0 cpu_halt+0x100: srl %i4, 0, %i0 cpu_halt+0x144: ldub [%i3 + 0xf9], %i0 cpu_halt+0x150: and %i0, 0xfd, %l7 cpu_halt+0x160: add %i2, 0x120, %i0 As we can see in this case, %i0 is reused very early in cpu_halt() and would be invalid in the stack backtrace. 14.1.11. Listing Processes and Process StacksWe can obtain the list of processes by using the ::ps dcmd. In addition, we can search for processes by using the pgrep(1M)-like ::pgrep dcmd. > ::ps -f S PID PPID PGID SID UID FLAGS ADDR NAME R 0 0 0 0 0 0x00000001 fec1d280 sched R 3 0 0 0 0 0x00020001 d318d248 fsflush R 2 0 0 0 0 0x00020001 d318daa8 pageout R 1 0 0 0 0 0x42004000 d318e308 /sbin/init R 9066 1 9066 9066 1 0x52000400 da2b7130 /usr/lib/nfs/nfsmapid R 9065 1 9063 9063 1 0x42000400 d965a978 /usr/lib/nfs/nfs4cbd R 4125 1 4125 4125 0 0x42000400 d9659420 /local/local/bin/httpd -k start R 9351 4125 4125 4125 40000 0x52000000 da2c0428 /local/local/bin/httpd -k start R 4118 1 4117 4117 1 0x42000400 da2bc988 /usr/lib/nfs/nfs4cbd R 4116 1 4116 4116 1 0x52000400 d8da7240 /usr/lib/nfs/nfsmapid R 4105 1 4105 4105 0 0x42000400 d9664108 /usr/apache/bin/httpd R 4263 4105 4105 4105 60001 0x52000000 da2bf368 /usr/apache/bin/httpd ... > ::ps -t S PID PPID PGID SID UID FLAGS ADDR NAME R 0 0 0 0 0 0x00000001 fec1d280 sched T t0 <TS_STOPPED> R 3 0 0 0 0 0x00020001 d318d248 fsflush T 0xd3108a00 <TS_SLEEP> R 2 0 0 0 0 0x00020001 d318daa8 pageout T 0xd3108c00 <TS_SLEEP> R 1 0 0 0 0 0x42004000 d318e308 init T 0xd3108e00 <TS_SLEEP> R 9066 1 9066 9066 1 0x52000400 da2b7130 nfsmapid T 0xd942be00 <TS_SLEEP> T 0xda68f000 <TS_SLEEP> T 0xda4e8800 <TS_SLEEP> T 0xda48f800 <TS_SLEEP> ... ::pgrep httpd > ::pgrep http S PID PPID PGID SID UID FLAGS ADDR NAME R 4125 1 4125 4125 0 0x42000400 d9659420 httpd R 9351 4125 4125 4125 40000 0x52000000 da2c0428 httpd R 4105 1 4105 4105 0 0x42000400 d9664108 httpd R 4263 4105 4105 4105 60001 0x52000000 da2bf368 httpd R 4111 4105 4105 4105 60001 0x52000000 da2b2138 httpd ... We can observe several aspects of the user process by using the ptool-like dcmds. > ::pgrep nscd S PID PPID PGID SID UID FLAGS ADDR NAME R 575 1 575 575 0 0x42000000 ffffffff866f1878 nscd > 0t575 |::pid2proc |::walk thread |::findstack (or) > ffffffff82f5f860::walk thread |::findstack stack pointer for thread ffffffff866cb060: fffffe8000c7fdd0 [ fffffe8000c7fdd0 _resume_from_idle+0xde() ] fffffe8000c7fe10 swtch+0x185() fffffe8000c7fe80 cv_wait_sig_swap_core+0x17a() fffffe8000c7fea0 cv_wait_sig_swap+0x1a() fffffe8000c7fec0 pause+0x59() fffffe8000c7ff10 sys_syscall32+0x101() ... > ffffffff866f1878::ptree fffffffffbc23640 sched ffffffff82f6b148 init ffffffff866f1878 nscd > ffffffff866f1878::pfiles FD TYPE VNODE INFO 0 CHR ffffffff833d4700 /devices/pseudo/mm@0:null 1 CHR ffffffff833d4700 /devices/pseudo/mm@0:null 2 CHR ffffffff833d4700 /devices/pseudo/mm@0:null 3 DOOR ffffffff86a0eb40 [door to 'nscd' (proc=ffffffff866f1878)] 4 SOCK ffffffff835381c0 > ffffffff866f1878::pmap SEG BASE SIZE RES PATH ffffffff85e416c0 0000000008046000 8k 8k [ anon ] ffffffff866ab5e8 0000000008050000 48k /usr/sbin/nscd ffffffff839b1950 000000000806c000 8k 8k /usr/sbin/nscd ffffffff866ab750 000000000806e000 520k 480k [ anon ] ... 14.1.12. Global Memory SummaryThe major buckets of memory allocation are available with the ::memstat dcmd. > ::memstat Page Summary Pages MB %Tot ------------ ---------------- ---------------- ---- Kernel 49022 191 19% Anon 68062 265 27% Exec and libs 3951 15 2% Page cache 4782 18 2% Free (cachelist) 7673 29 3% Free (freelist) 118301 462 47% Total 251791 983 Physical 251789 983 14.1.13. Listing Network ConnectionsWe can use the ::netstat dcmd to obtain the list of network connections. > ::netstat TCPv4 St Local Address Remote Address Zone da348600 6 10.0.5.104.63710 10.0.5.10.38189 7 da348a80 0 10.0.5.106.1016 10.0.5.10.2049 2 da34fc40 0 10.0.5.108.1018 10.0.5.10.2049 3 da3501c0 0 10.0.4.106.22 192.18.42.17.64836 2 d8ed2800 0 10.0.4.101.22 192.18.42.17.637 ... 14.1.14. Listing All Kernel ThreadsA stack backtrace of all threads in the kernel can be obtained with the ::threadlist dcmd. (If you are familiar with adb, this is a modern version of adb's $<threadlist macro). With this dcmd, we can quickly and easily capture a useful snapshot of all current activity in text form, for deeper analysis. > ::threadlist ADDR PROC LWP CMD/LWPID fec1dae0 fec1d280 fec1fdc0 sched/1 d296cde0 fec1d280 0 idle() d2969de0 fec1d280 0 taskq_thread() d2966de0 fec1d280 0 taskq_thread() d2963de0 fec1d280 0 taskq_thread() d2960de0 fec1d280 0 taskq_thread() d29e3de0 fec1d280 0 taskq_thread() d29e0de0 fec1d280 0 taskq_thread() ... > ::threadlist -v ADDR PROC LWP CLS PRI WCHAN fec1dae0 fec1d280 fec1fdc0 0 96 0 PC: 0xfe82b507 CMD: sched stack pointer for thread fec1dae0: fec33df8 swtch+0x165() sched+0x3aa() main+0x365() d296cde0 fec1d280 0 0 -1 0 PC: 0xfe82b507 THREAD: idle() stack pointer for thread d296cde0: d296cd88 swtch+0x165() idle+0x32() thread_start+8() ... # echo "::threadlist" |mdb -k >mythreadlist.txt 14.1.15. Other Notable Kernel dcmdsThe ::findleaks dcmd efficiently detects memory leaks in kernel crash dumps when the full set of kmem debug features has been enabled. The first execution of ::findleaks processes the dump for memory leaks (this can take a few minutes), then coalesces the leaks by the allocation stack trace. The findleaks report shows a bufctl address and the topmost stack frame for each memory leak that was identified. See Section 11.4.9.1 in Solaris™ Internals for more information on ::findleaks. > ::findleaks CACHE LEAKED BUFCTL CALLER 70039ba8 1 703746c0 pm_autoconfig+0x708 70039ba8 1 703748a0 pm_autoconfig+0x708 7003a028 1 70d3b1a0 sigaddq+0x108 7003c7a8 1 70515200 pm_ioctl+0x187c ------------------------------------------------------ Total 4 buffers, 376 bytes If the -v option is specified, the dcmd prints more verbose messages as it executes. If an explicit address is specified prior to the dcmd, the report is filtered and only leaks whose allocation stack traces contain the specified function address are displayed. The ::vatopfn dcmd translates virtual addresses to physical addresses, using the appropriate platform translation tables. > fec4b8d0::vatopfn level=1 htable=d9d53848 pte=30007e3 Virtual fec4b8d0 maps Physical 304b8d0 The ::whatis dcmd attempts to determine if the address is a pointer to a kmem-managed buffer or another type of special memory region, such as a thread stack, and reports its findings. When the -a option is specified, the dcmd reports all matches instead of just the first match to its queries. When the -b option is specified, the dcmd also attempts to determine if the address is referred to by a known kmem bufctl. When the -v option is specified, the dcmd reports its progress as it searches various kernel data structures. See Section 11.4.9.2 in Solaris™ > 0x705d8640::whatis 705d8640 is 705d8640+0, allocated from streams_mblk The ::kgrep dcmd lets you search the kernel for occurrences of a supplied value. This is particularly useful when you are trying to debug software with multiple instances of a value. > 0x705d8640::kgrep 400a3720 70580d24 7069d7f0 706a37ec 706add34 |
EAN: 2147483647
Pages: 180