Section 10.4. DTrace Architecture
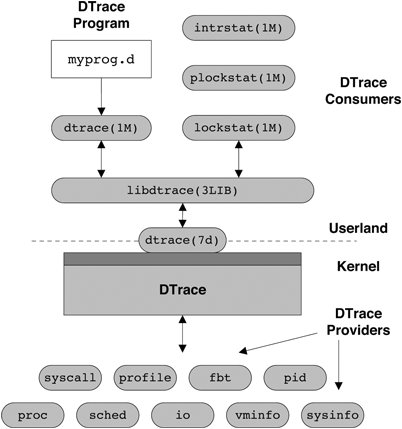
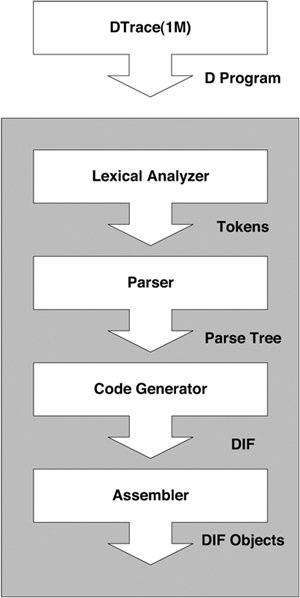
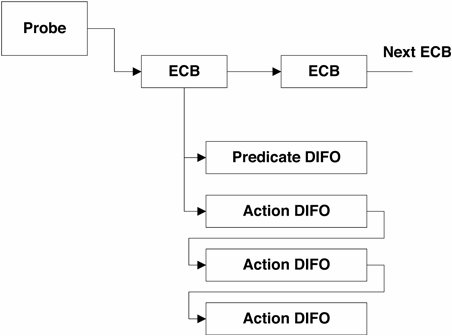
10.4. DTrace ArchitectureAlthough DTrace instruments are found at both user and kernel level, the majority of the instrumentation and probe-processing activity take place in the Solaris kernel. This section looks at the basic architecture of DTrace, provides a high-level overview of the process of instrumentation, and examines what happens when this instrumentation is activated. Figure 10.1 presents the architecture of the DTrace subsystem. Figure 10.1. DTrace Architecture Processes, known as consumers, communicate with the DTrace kernel subsystem through the interfaces provided in the DTrace library, libdtrace(3LIB). Data is transferred between consumers and the kernel by ioctl(2) calls on the dtrace pseudo-device provided by the dtrace(7d) device driver. Several consumers are included in Solaris 10, including lockstat(1M), plockstat(1M), and intrstat(1M), but generalized access to the DTrace facility is provided by the dtrace(1M) consumer. A consumer's basic jobs are to communicate tracing specifications to the DTrace kernel subsystem and to process data resulting from these specifications. A key component of libdtrace is the D compiler. The role of a compiler is to transform a high-level language into the native machine language of the target processor, the high-level language in this case being D. However, DTrace implements its own virtual machine with its own machine-independent instruction set called DIF (D Intermediate Format), which is the target language for compilation. The tracing scripts we specify are transformed into the DIF language and emulated in the kernel when a probe fires, in much the same way as a Java virtual machine interprets Java bytecodes. One of the most important properties of DTrace is its ability to execute arbitrary code safely on production systems without inducing failure. The use of a runtime emulation environment ensures that errors such as dereferencing null pointers can be caught and dealt with safely. The basic architecture and flow of the D compiler is shown in Figure 10.2. Figure 10.2. DTrace Architecture Flow The input D script is split up into tokens by the lexical analyzer; the tokens are used by the parser to build a parse tree. The code generator then makes several passes over the nodes in the parse tree and generates the DIF code for each of the nodes. The assembler then builds DIF Objects (DIFO) for the generated DIF. A DIFO stores the return type of the D expression encoded by this piece of DIF along with its string and variable tables. All the individual pieces of DIFO that constitute a D program are put together into a file. The format of this file is known as the DTrace Object Format (DOF). This DOF is then injected into the kernel and the system is instrumented. Take as an example the following D clause: syscall::write:entry /execname == "foo" && uid == 1001/ { self->me = 1; } This clause contains two DIF objects, one for the predicate and one for the single action. We can use the -S option to dtrace to look at the DIF instructions generated when the clauses are compiled. Three DIF instructions are generated for the single action shown above. OFF OPCODE INSTRUCTION 00: 25000001 setx DT_INTEGER[0], %r1 ! 0x1 01: 2d050001 stts %r1, DT_VAR(1280) ! DT_VAR(1280) = "me" 02: 23000001 ret %r1 The DIF virtual machine is a simple RISC-like environment with a limited set of registers and a small instruction set. The first instruction loads register r1 with the first value in a DIFO-specific array of integer constants. The second instruction stores the value that is now in register r1 into the thread-specific variable me, which is referenced through the DIFO-specific variable table. The third instruction returns the value stored in register r1. The encodings for DIF instructions are called opcodes; it is these that are stored in the DIFO. Each instruction is a fixed 4 bytes, so this DIFO contains 12 bytes of encoded DIF. The DOF generated by the compilation process is sent to the DTrace kernel subsystem, and the system is instrumented accordingly. When a probe is enabled, an enabling control block (ECB) is created and associated with the probe (see Figure 10.3). An ECB holds some consumer-specific state and also the DIFOs for this probe enabling. If it is the first enabling for this probe, then the framework calls the appropriate provider, instructing it to enable this probe. Each ECB contains the DIFO for the predicates and actions associated with this enabling of the probe. All the enablings for a probe, whether by one or multiple consumers, are represented by ECBs that are chained together and processed in order when the probe is fired. The order is dictated by the sequence in which they appear in a D script and by the time at which that the instrumentation occurs (for example, new ECBs are put at the end of existing ECBs). Figure 10.3. Enabling Control Blocks (ECBs) The majority of the DTrace subsystem is implemented as a series of kernel modules with the core framework being implemented in dtrace(7d). The framework itself performs no actual instrumentation; that is the responsibility of loadable kernel modules called providers. The providers have intimate knowledge of specific subsystems: how they are instrumented and exactly what can be instrumented (these individual sites being identified by a probe). When a consumer instructs a provider to enable a probe, the provider modifies the system appropriately. The modifications are specific to the provider, but all instrumentation methods achieve the same goal of transferring control into the DTrace framework to carry out the tracing directives for the given probe. This is achieved by execution of the dtrace_probe() function. As an example of instrumentation, let's look at how the entry point to the ufs_write() kernel function is instrumented by the fbt provider on the SPARC platform. A function begins with a well-known sequence of instructions, which the fbt provider looks for and modifies. sol10 # mdb -k Loading modules: [ unix krtld genunix dtrace specfs ufs ip sctp usba uhci fctl s1394 nca lofs audiosup nfs random sppp crypto ptm ipc ] > ufs_write::dis -n 1 ufs_write: save %sp, -0x110, %sp ufs_write+4: stx %i4, [%sp + 0x8af] The save instruction on the SPARC machine allocates stack space for the function to use, and most functions begin with this. If we enable fbt::ufs_write:entry in another window, ufs_write() now looks like this: > ufs_write::dis -n 1 ufs_write: ba,a +0x2bb388 <dt=0x3d96> ufs_write+4: stx %i4, [%sp + 0x8af] The save instruction has been replaced with a branch to a different location. In this case, the location is the address of the first instruction in ufs_write + 0x2bb388. So, looking at the contents of that location, we see the following: > ufs_write+0x2bb388::dis 0x14b36ec: save %sp, -0x110, %sp 0x14b36f0: sethi %hi(0x3c00), %o0 0x14b36f4: or %o0, 0x196, %o0 0x14b36f8: mov %i0, %o1 0x14b36fc: mov %i1, %o2 0x14b3700: mov %i2, %o3 0x14b3704: mov %i3, %o4 0x14b3708: mov %i4, %o5 0x14b370c: sethi %hi(0x11f8000), %g1 0x14b3710: call -0xe7720 <dtrace_probe> 0x14b3714: or %g1, 0x360, %o7 The save instruction that was replaced is executed first. The next seven instructions set up the input arguments for the call to dtrace_probe(), which transfers control to the DTrace framework. The first argument loaded into register o0 is the probe ID for ufs_write, which is used to find the ECBs to be executed for this probe. The next five mov instructions copy the five input arguments for ufs_write so that they appear as arguments to dtrace_probe(). They can then be used when probe processing occurs. This example illustrates how a kernel function's entry point is instrumented. Instrumenting, for example, a system call entry point requires a very different instrumentation method. Placing the domain-specific knowledge in provider modules makes DTrace easily extensible in terms of instrumenting different software subsystems and different hardware architectures. When a probe is fired, the instrumentation inserted by the provider transfers control into the DTrace framework and we are now in what is termed "probe context." Interrupts are disabled for the executing CPU. The ECBs that are registered for the firing probe are iterated over, and each DIF instruction in each DIFO is interpreted. Data generated from the ECB processing is buffered in a set of per-consumer, per-CPU buffers that are read periodically by the consumer. When a tracing session is terminated, all instrumentation carried out by providers is removed and the system returns to its original state. |
EAN: 2147483647
Pages: 180