Section 3.3. Dispatcher Queues, Structures, and Variables
3.3. Dispatcher Queues, Structures, and VariablesDispatcher queues, or run queues, are linked lists of runnable kernel threads (threads in the RUN state), waiting to be selected by the dispatcher for execution on a processor. Solaris implements per-processor dispatch queues; that is, every processor on a Solaris system is initialized with its own set of dispatcher queues. The queues are organized as an array of queues, where a separate linked list of threads is maintained for each global priority. The per-processor queue arrangement improves scalability, eliminating the potential for a highly contended mutex lock that would be required for a global, systemwide queue. Additionally, per-processor queues simplify managing affinity and binding of threads to processors, since bound threads are simply placed on the dispatch queue of the processor to which they are bound. Processors with more than one execution core per processor, such as Sun's UltraSPARC IV+, which has two cores per processor chip, have a dispatch queue per core. That is, the kernel configures each execution core as a processor. Sun's Sun Fire T1000 and T2000 servers, based on the UltraSPARC T1, are configured such that each hardware thread is a processor to the kernel dispatcher. For the typical configuration of a fully loaded T1000 or T2000, with eight execution cores, each with four hardware threads per core, Solaris will configure (8 x 4) 32 processors, each with its own set of dispatch queues. These per-processor queues are used for threads in all scheduling classes, with the exception of real-time threads. The real-time scheduling class offers a unique set of features for applications with specific requirements. For optimal support for real-time, real-time threads are placed on a special set of dispatcher queues, called kernel preemption queues, or kp queues. Whenever a real-time thread is placed on a kp queue, a kernel preemption is generated, forcing the processor to enter the scheduler (see Section 3.9). 3.3.1. Dispatcher StructuresThe dispatcher uses several data structures and per-structure variables to perform the tasks of thread management, queue management, and scheduling. These tasks are quite complex, especially on systems with multiple processors running workloads with hundreds or thousands of active threads. Resource management facilities for pools of processors and binding, dynamic reconfiguration capabilities, and processor state changes (offline, online) all combine to make dispatcher functions a delicate dance that required some brilliant engineering to maintain correctness while providing excellent performance and scalability. The dispatcher uses the following data structures and variables:
3.3.2. Dispatcher Structure LinkageSpecific details on how and where the structure variables are used by the dispatcher are discussed in the following sections. First, let's look at how the structure pieces fits together in Figure 3.4. For clarity, the class-specific data that is linked to a kernel thread's t_cldata pointer is not shown in the figure. Figure 3.4. Dispatcher Queue Structures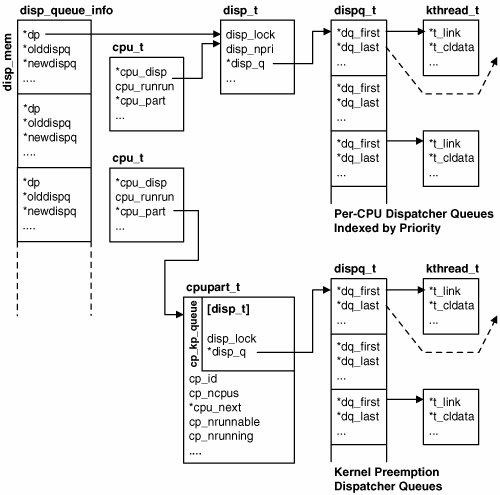 The diagram in Figure 3.4 shows the organization of the per-processor dispatcher queues, used for queueing all runnable threads except those in the real-time scheduling class. There is a dispq_t for every global priority, ordered numerically in descending order. That is, the first dispq_t is the root of all threads at the highest (best) global priority (either 109 or 169. See Section 3.6 for the particulars), the next one down links threads at next lowest priority, and so on. Dispatcher queues for real-time threads (kp queues) are managed in a slightly different way. The per-priority queue arrangement is the same (60 queues for real-time priorities 059), but the number of actual queues is not per-processor, but rather per-processor partition or processor set. By default, on a Solaris system that has not had any user-defined processor sets created, there will be one systemwide kp_preempt queue for real-time threads. If processor sets are created, then the number of kp_queues will equal the number of configured processor sets plus 1. That is, one kp_queue per processor set, plus one for the default (system) set. Note also that the disp_t structure is embedded in the cpupart_t structure, as opposed to a pointer link. The dispatcher structures are created and initialized at boot time in accordance with the number of processors installed on the system. Initialization functions can also be called while the system is up and running in order to support the dynamic reconfiguration capabilities of some of Sun's server systems. For example, adding a system board to a high-end server will change the number of available processors, requiring to kernel to allocate and initialize structures for the additional processors. Also, scheduling classes are implemented as dynamically loadable kernel modules; the loading of a scheduling class requires calling dispatcher initialization functions. 3.3.3. Examining Dispatcher StructuresLet's quickly look at how we can examine these structures on a running system and thus determine the values of the structure variables of interest. We use the system debugger, mdb(1), as well as dtrace(1). # mdb -k > ::cpuinfo ID ADDR FLG NRUN BSPL PRI RNRN KRNRN SWITCH THREAD PROC 0 0000180c000 1b 0 0 17 no t-2 300022f7660 threads 1 30001b50000 1b 0 0 17 no no t-0 30002def920 threads 4 30001b52000 1b 1 0 51 no no t-0 30003c1e640 tar 5 30001bf2000 1b 0 0 59 no no t-0 300065a3320 mdb 8 30001bf0000 1b 0 0 59 no no t-0 300063d2cc0 sshd 9 30001be6000 1b 1 0 32 no no t-0 300065a29c0 tar 12 30001be0000 1b 0 0 17 no no t-1 300061c9c80 threads 13 30001bdc000 1b 0 0 17 no no t-2 3000230b960 threads The mdb ::cpuinfo dcmd provides a tabular summary for every CPU on the system. In this example, we have eight CPUs. The cpuinfo output provides several interesting bits of information used by the dispatcher. We can see the name of the process the CPU is executing (if it's running a process thread at the time the command is executed), the address of the thread structure (THREAD), the priority of the running thread (PRI), and the number of runnable threads on the CPU's dispatch queues (NRUN). The ADDR column is the kernel virtual address of the processor's cpu_t structure. The RNRN and KRNRN fields represent the CPU's cpu_runrun and cpu_kprunrun flags, respectively. These flags trigger a preemption. A preemption is initiated by the operating system when an event occurs that requires a processor's attention, such as a thread insertion on a CPU's dispatch queue that is of a higher priority than the CPU's current highest-priority thread. Solaris defines user preemptions, triggered by cpu_runrun, and kernel preemptions, triggered by cpu_kprunrun. See Section 3.9. Displaying the entire cpu_t for a CPU is a simple matter of grabbing the address (ADDR) of the desired CPU and using the mdb(1) print command. > 30001be0000::print cpu_t { cpu_id = 0xc cpu_seqid = 0x6 cpu_flags = 0x1b cpu_self = 0x30001be0000 cpu_thread = 0x30003b909e0 ... cpu_disp = 0x30001b2ecd8 cpu_runrun = '\0' cpu_kprunrun = '\0' cpu_chosen_level = 0xffff cpu_dispthread = 0x300061c9640 cpu_thread_lock = 0 cpu_disp_flags = 0 cpu_dispatch_pri = 0x31 ... The output from the above command is quite large; we snipped most of it for this example. This gives us another view of some of the per-CPU data displayed by the cpuinfo dcmd, such as the CPU preemption flags (runrun), the address of the thread structure running on the CPU, the CPU's current priority, and the like. The cpu_disp field provides the address of the CPU's dispatcher (disp_t) structure. > 30001b2ecd8::print disp_t { disp_lock = 0 disp_npri = 0x6e disp_q = 0x30001be4a80 disp_q_limit = 0x30001be54d0 disp_qactmap = 0x30001b73a58 disp_maxrunpri = 0xffff disp_max_unbound_pri = 0xffff disp_nrunnable = 0 disp_cpu = 0x30001be0000 } The disp_t fields include a dispatcher lock (see Section 3.4), the number of global priorities on the system (0x6E = 110 decimal. Section 3.7.1 explains this value). The disp_maxrunpri value of 0xffff equates to -1, which means the CPU is not currently running a thread (the CPU is idle). Other variables in the structure and others we have examined are described in the following sections that cover the execution of key dispatcher functions. Be aware that examining this data on a running system is a moving target. Many of these fields change hundreds or thousands of times per second. That is why certain variables, such as thread address and priority, appear different as we move through the examples. Pipelines of mdb(1) dcmds can be grouped to provide a more direct path to data of interest. Below is a snapshot of the priority of the thread running on a CPU, for all CPUs. > ::walk cpu |::print cpu_t cpu_thread |::print kthread_t t_pri t_pri = 0x11 t_pri = 0xffff t_pri = 0x1d t_pri = 0xffff t_pri = 0x1d t_pri = 0x11 t_pri = 0x11 t_pri = 0x11 > Here we see that of the eight CPUs, two are idle (t_pri = 0xffff), four are running threads at priority 17 (0x11 = 17 decimal), and two are running threads at priority 29 (0x1d = 29 decimal). Having a look at the kp_queue requires dumping the cpupart_t structure linked to a CPU of interest. In this example, a user-defined processor set has not been created, so we have the default set, which is all the processors on the system. For referencing the default (system) kp_queue, a kernel variable, cp_default, is set in the dispatcher code for quick reference to the default partition data. On systems that have not had processor sets or resource pools configured, there will be one kp_preempt queue for the entire system. > cp_default::print cpupart_t { cp_kp_queue = { disp_lock = 0 disp_npri = 0xaa disp_q = 0xd2e84800 disp_q_limit = 0xd2e84ff8 disp_qactmap = 0xd2cee158 disp_maxrunpri = 0xffff disp_max_unbound_pri = 0xffff disp_nrunnable = 0 disp_cpu = 0 } cp_id = 0 cp_ncpus = 0x1 .... Note that the embedded disp_t is properly formatted as part of the cpupart_t formatted structure output. For systems with configured processor sets or resource pools, use the cpu_part pointer in a CPU that is a member of the set of interest. You can use a simple but powerful command pipeline to format and dump the cpupart_t, as shown in the next example. > ::cpuinfo ID ADDR FLG NRUN BSPL PRI RNRN KRNRN SWITCH THREAD PROC 0 0000180c000 1b 0 0 -1 no no t-1 2a10001fcc0 (idle) 1 30001bcc000 1b 0 0 120 no no t-44 30002c37300 cpuhog 4 30001bce000 1b 0 0 -1 no no t-6 2a10038fcc0 (idle) 5 30001c6e000 1b 0 0 120 no no t-39 300029c15e0 cpuhog 8 30001c6c000 1b 0 0 -1 no no t-1 2a100501cc0 (idle) 9 30001c62000 1b 0 0 120 no no t-41 300022ca040 cpuhog 12 30001c5c000 1b 0 0 120 no no t-36 300028aa680 cpuhog 13 30001c58000 1b 0 0 59 no no t-1 30002a49920 mdb > 30001bcc000::print cpu_t cpu_part |::print cpupart_t { cp_kp_queue = { disp_lock = 0 disp_npri = 0xaa disp_q = 0x30002901000 disp_q_limit = 0x30002901ff0 disp_qactmap = 0x3000622f398 disp_maxrunpri = 0xffff disp_max_unbound_pri = 0xffff disp_nrunnable = 0 disp_cpu = 0 } cp_id = 0 cp_ncpus = 0x8 cp_next = cp_default cp_prev = cp_default cp_cpulist = cpu0 cp_kstat = kstat_initial+0xb1a0 cp_nrunnable = 0x1 cp_nrunning = 0x8 cp_updates = 0x31868d cp_nrunnable_cum = 0x1058 cp_nwaiting_cum = 0 cp_loadavg = { lg_cur = 0x7 lg_len = 0xb lg_total = 0 lg_loads = [ 0x10edc5006, 0xf84cace8, 0xd9dcafcb, 0xce1366e8, 0x1103a83ac, 0xb9e7b718, 0x943a762f , 0xf5eb8825, 0xa56f5481, 0x135dd9a10, 0x984b5f3c ] } cp_lgrpset = 0x1 cp_lgrploads = cp_default_lpls cp_nlgrploads = 0x5 cp_hp_avenrun = [ 0x3e292, 0x3e268, 0x3ada9 ] cp_attr = 0x1 cp_gen = 0 } > DTrace can also be used to examine dispatcher events of interest on a running system. For example, we may wish to monitor the number of runnable threads on a per-CPU basis, as well as RT-class threads on the kp_queue. The following dtrace script uses the dtrace FBT provider and segues nicely into a description of the dispatcher queue management functions since we enable probes in the queue insertion functions to track run queue depth. For non-RT-class threads, the kernel inserts a thread on either the front or back of the target dispatch queue, using either setfrontdq() or setbackdq(), so we instrument the entry points for these functions and grab the disp_nrunnable value when these probes fire. Insertions onto the kp_queue are done with the setkpdq() kernel function, so the D script enables a probe at the entry point of that function and grabs the nrunnable value for the queue. The aggregation keys are the CPU ID for the per-CPU queues and the partition ID for the kp_queues, so we get queue depth for all CPUs and queue depth for all kp_queues. Here is the dtrace D script. # !/usr/sbin/dtrace -qs long dq_enters; long kpdq_enters; fbt::setfrontdq:entry, fbt::setbackdq:entry { dq_enters++; cpu_id = args[0]->t_cpu->cpu_id; dqcnt = args[0]->t_cpu->cpu_disp->disp_nrunnable; @nrt[cpu_id] = quantize(dqcnt); } fbt::setkpdq:entry { kpdq_enters++; part_id = args[0]->t_cpu->cpu_part->cp_id; kpqcnt = args[0]->t_cpu->cpu_part->cp_kp_queue.disp_nrunnable; @rt[part_id] = quantize(kpqcnt); } tick-5sec { printf("Non RT Class Threads, by CPU (%ld enters)\n",dq_enters); printa(@nrt); printf("\nRT Class Threads, by Partition ID (%ld enters)\n",kpdq_enters); printa(@rt); trunc(@nrt); trunc(@rt); dq_enters = 0; kpdq_enters = 0; printf("\n\n"); } Here is sample output from running the script for a few seconds on a four-processor system. A processor set has been created on the system, with CPU 1 the only CPU in the set. A multithreaded process was bound to the processor set and put in the real-time scheduling class. A second multithreaded process is running across the remaining three CPUs in the default (system) set. # ./rqcc.d Non RT Class Threads, by CPU (48669 enters) 1 value ------------- Distribution ------------- count 0 | 0 1 |@@@@@@@@@@@@@@@@@@@@@@@@@@@@@@@@@@@@@@@@ 106 2 | 1 4 | 0 2 value ------------- Distribution ------------- count -1 | 0 0 |@@@@@@@@@@@@@ 1559 1 |@@@@@@@@@@@@@@@@@@ 2153 2 |@@@@@@@@@ 1128 4 | 12 8 | 0 3 value ------------- Distribution ------------- count -1 | 0 0 |@@@@@@@@@@@@ 6354 1 |@@@@@@@@@@@@@@@@@@@ 9557 2 |@@@@@@@@@ 4515 4 | 69 8 | 0 0 value ------------- Distribution ------------- count -1 | 0 0 |@@@@@@@@@ 5505 1 |@@@@@@@@@@@@@@@@@@@ 11081 2 |@@@@@@@@@@@@ 6949 4 |@ 306 8 | 0 RT Class Threads, by Partition ID (1146 enters) 0 value ------------- Distribution ------------- count -1 | 0 0 |@@@@@@@@@@@@@@@@@@@@@@@@@@@@@@@@@@@@@@@@ 1062 1 | 0 1 value ------------- Distribution ------------- count 4 | 0 8 |@@@@@@@@@@@@@@@@@@@@@@@@@@@@@@@@@@@@@@@@ 106 16 | 0 Referencing the sample output on the previous page, the "RT Class threads, by Partition ID" data shows two aggregations since there are two partitions (the default, and the one we created). The default partition (ID 0) also has a zero value for the count of runnable threads, which is expected since we ran the RT-class threads on the user-defined set (partition 1), which shows a varying number of runnable threads on the kp_queue. The "Non-RT Class Threads, by CPU" shows a queue depth of various sizes over the source of the sampling period for each CPU. The output data is in the form of aggregations; the result of the dtrace quantize aggregating function, which takes a scalar value as an argument and aggregates according to the value into a power-of-two distribution. The left column, value, represents a range of values of the aggregated data (the number of runnable threads on the queue in the case). The right column, count, represents the number of times the aggregated data fell within the corresponding value range. For example, looking at the CPU 0 distribution, the nrunnable value was 0 for 5505 occurrences of the probe firing. The value was 1 for 11081 occurrences of the probe firing. The value was not less than 2 and not greater than 4 (that is, 2 or 3) for 6949 occurrences of the probe firing, and the value was not less than 4 and not greater than 8 for 306 occurrences of the probe firing. |
EAN: 2147483647
Pages: 244