Summarizing Data
 |
| |||||||||
After grouping the fields, the Report Creation Wizard helps you summarize the data you’ve selected. If you’ve grouped the data, the fields involved in the grouping are automatically added to the Summarized Fields list. The Summaries dialog is shown in Figure 1.18. To summarize data, you choose a field to summarize and a summarization method.
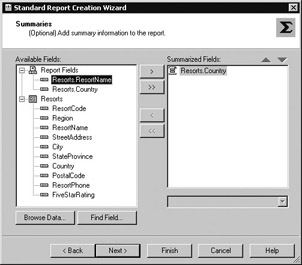
Figure 1.18. Summaries dialog
Business Question: How many resorts does VistaNations have in each country and what are their names?
Our business question requires that we count how many resorts are in each country. Count is a summarization method. We will summarize based on the Country field using a count summarization. We select the Country field from the list on the left and copy it to the list on the right using the buttons between the two lists.
A default summarization method will be automatically set for you, as shown in Figure 1.19, but you can change to another type of summarization method by selecting it from the drop-down list. The default method set is based on the type of data contained in the field you are summarizing. Table 1.3 describes each of the summarization methods.
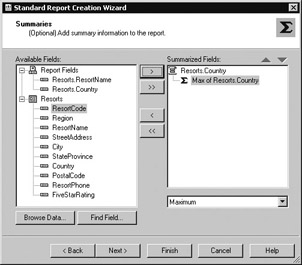
Figure 1.19. Summarization default
| Summarization | Description |
|---|---|
| Maximum | Given a set of values, returns the largest value |
| Minimum | Given a set of values, returns the smallest value |
| Count | A number representing how many times the value appears in the field |
| Distinct Count | A number representing how many times the value uniquely appears in the field |
| Mode | Given a set of values, returns the value that occurs most frequently in the field |
| Nth largest, N is: | Type a value for N as an integer number (e.g., 5) and from a set of values in the report, Crystal returns the N largest values (in this case, the 5 largest values) |
| Nth smallest, N is: | Type a value for N as an integer number (e.g., 7) and from the set of all values, Crystal returns the N smallest values (in this case, the 7 smallest values) |
| Nth most frequent, N is: | Type a value for N as an integer number (e.g., 9) and from the set of values in the data source, returns the N most frequently occurring values; similar to Mode. |
The summarization techniques available are determined by the data values stored in the field. To answer our business question, the Count summarization method makes the most sense, as shown in Figure 1.20. It allows you to summarize nonnumerical data by counting instances of a value.
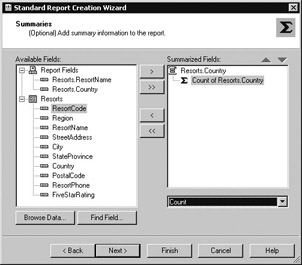
Figure 1.20. Count summarization method
Notice that the sigma symbol appears indented under the grouping symbol in the graphic above. What this means is that the report will show a count for each unique grouping. For instance, if the Country is Canada, there will be a number representing how many resorts are in Canada. Likewise, if the Country is the United States, there will be a number representing how many resorts are in the United States. The indenting gives you a visual idea of how the summarization will be done in the report.
| Note | After the wizard completes and you are in the Crystal Reports design environment, you can summarize field data using the toolbar. Notice the icon in the top-right corner of the Summaries dialog, shown in Figure 1.20. This icon will appear on the Crystal Reports toolbar later. |
Creating the Reports
At this point you’ve done the following:
-
Connected to a data source
-
Chosen a table and fields to use in the report
-
Created a group based on sorted field data
-
Summarized data based on a field
You’re ready to generate the report! To do this using the Report Creation Wizard, simply click the Finish button.
| Use of content on this site is expressly subject to the restrictions set forth in the Membership Agreement | |
| Conello © 2000-2003 Feedback | |
EAN: 2147483647
Pages: 217