5.1 Project Size
5.1 Project Size
The largest driver in a software estimate is the size of the software being built, because there is more variation in the size than in any other factor. Figure 5-1 shows the way that effort grows in an average business-systems project as project size increases from 25,000 lines of code to 1,000,000 lines of code. The figure expresses size in lines of code (LOC), but the dynamic would be the same whether you measured size in function points, number of requirements, number of Web pages, or any other measure that expressed the same range of sizes.
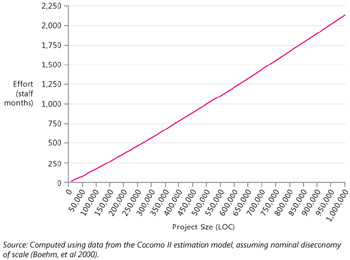
Figure 5-1: Growth in effort for a typical business-systems project. The specific numbers are meaningful only for the average business-systems project. The general dynamic applies to software projects of all kinds.
As the diagram shows, a system consisting of 1,000,000 LOC requires dramatically more effort than a system consisting of only 100,000 LOC.
These comments about software size being the largest cost driver might seem obvious, yet organizations routinely violate this fundamental fact in two ways:
-
Costs, effort, and schedule are estimated without knowing how big the software will be.
-
Costs, effort, and schedule are not adjusted when the size of the software is consciously increased (that is, in response to change requests).
| Tip #24 | Invest an appropriate amount of effort assessing the size of the software that will be built. The size of the software is the single most significant contributor to project effort and schedule. |
Why Is This Book Discussing Size in Lines of Code?
People new to estimation sometimes have questions about whether lines of code are really a meaningful way to measure software size. One issue is that many modern programming environments are not as lines-of-code-oriented as older environments were. Another issue is that a lot of software development work—such as requirements, design, and testing—doesn't produce lines of code. If you're interested in seeing how these issues affect the usefulness of measuring size in lines of code, see Section 18.1, "Challenges with Estimating Size."
Diseconomies of Scale
People naturally assume that a system that is 10 times as large as another system will require something like 10 times as much effort to build. But the effort for a 1,000,000-LOC system is more than 10 times as large as the effort for a 100,000-LOC system, as is the effort for a 100,000-LOC system compared to the effort for a 10,000-LOC system.
The basic issue is that, in software, larger projects require coordination among larger groups of people, which requires more communication (Brooks 1995). As project size increases, the number of communication paths among different people increases as a squared function of the number of people on the project. [1] Figure 5-2 illustrates this dynamic.
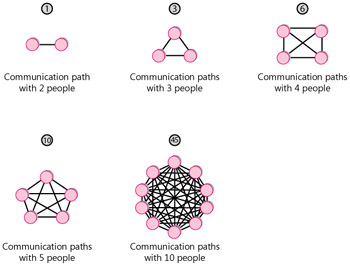
Figure 5-2: The number of communication paths on a project increases proportionally to the square of the number of people on the team.
The consequence of this exponential increase in communication paths (along with some other factors) is that projects also have an exponential increase in effort as a project size increases. This is known as a diseconomy of scale.
Outside software, we usually discuss economies of scale rather than diseconomies of scale. An economy of scale is something like, "If we build a larger manufacturing plant, we'll be able to reduce the cost per unit we produce." An economy of scale implies that the bigger you get, the smaller the unit cost becomes.
A diseconomy of scale is the opposite. In software, the larger the system becomes, the greater the cost of each unit. If software exhibited economies of scale, a 100,000-LOC system would be less than 10 times as costly as a 10,000-LOC system. But the opposite is almost always the case.
Figure 5-3 illustrates a typical diseconomy of scale in software compared with the increase of effort that would be associated with linear growth.
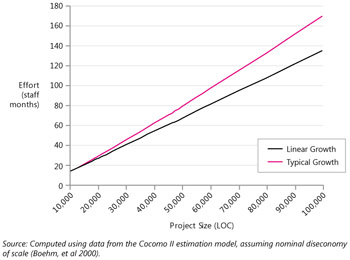
Figure 5-3: Diseconomy of scale for a typical business-systems project ranging from 10,000 to 100,000 lines of code.
As you can see from the graph, in this example, the 10,000-LOC system would require 13.5 staff months. If effort increased linearly, a 100,000-LOC system would require 135 staff months, but it actually requires 170 staff months.
As Figure 5-3 is drawn, the effect of the diseconomy of scale doesn't look very dramatic. Indeed, within the 10,000 LOC to 100,000 LOC range, the effect is usually not all that dramatic. But two factors make the effect more dramatic. One factor is greater difference in project size, and the other factor is project conditions that degrade productivity more quickly than average as project size increases. Figure 5-4 shows the range of outcomes for projects ranging from 10,000 LOC to 1,000,000 LOC. In addition to the nominal diseconomy, the graph also shows the worst-case diseconomy.
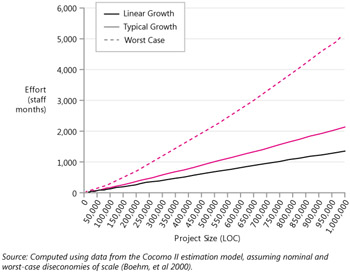
Figure 5-4: Diseconomy of scale for projects with greater size differences and the worst-case diseconomy of scale.
In this graph, you can see that the worst-case effort growth increases much faster than the nominal effort growth, and that the effect becomes much more pronounced at larger project sizes. Along the nominal effort growth curve, effort at 100,000 lines of code is 13 times what it is at 10,000 lines of code, rather than 10 times. At 1,000,000 LOC, effort is 160 times the 10,000-LOC effort, rather than 100 times.
The worst-case growth is much worse. Effort on the worst-case curve at 100,000 LOC is 17 times what it is at 10,000 LOC, and at 1,000,000 LOC it isn't 100 times as large—it's 300 times as large!
Table 5-1 illustrates the general relationship between project size and productivity.
| Project Size (in Lines of Code) | Lines of Code per Staff Year (Cocomo II Nominal in Parentheses) |
|---|---|
| 10K | 2,000–25,000 (3,200) |
| 100K | 1,000–20,000 (2,600) |
| 1M | 700–10,000 (2,000) |
| 10M | 300–5,000 (1,600) |
| Source: Derived from data in Measures for Excellence (Putnam and Meyers 1992), Industrial Strength Software (Putnam and Meyers 1997), Software Cost Estimation with Cocomo II (Boehm et al. 2000), and "Software Development Worldwide: The State of the Practice" (Cusumano et al. 2003). | |
The numbers in this table are valid only for purposes of comparison between size ranges. But the general trend the numbers show is significant. Productivity on small projects can be 2 to 3 times as high as productivity on large projects, and productivity can vary by a factor of 5 to 10 from the smallest projects to the largest.
| Tip #25 | Don't assume that effort scales up linearly as project size does. Effort scales up exponentially. |
For software estimation, the implications of diseconomies of scale are a case of good news, bad news. The bad news is that if you have large variations in the sizes of projects you estimate, you can't just estimate a new project by applying a simple effort ratio based on the effort from previous projects. If your effort for a previous 100,000-LOC project was 170 staff months, you might figure that your productivity rate is 100,000/170, which equals 588 LOC per staff month. That might be a reasonable assumption for another project of about the same size as the old project, but if the new project is 10 times bigger, the estimate you create that way could be off by 30% to 200%.
There's more bad news: There isn't a simple technique in the art of estimation that will account for a significant difference in the size of two projects. If you're estimating a project of a significantly different size than your organization has done before, you'll need to use estimation software that applies the science of estimation to compute the estimate for the new project based on the results of past projects. My company provides a free software tool called Construx® Estimate™ that will do this kind of estimate. You can download a copy at www.construx.com/estimate.
| Tip #26 | Use software estimation tools to compute the impact of diseconomies of scale. |
When You Can Safely Ignore Diseconomies of Scale
After all that bad news, there is actually some good news. The majority of projects in an organization are often similar in size. If the new project you're estimating will be similar in size to your past projects, it is usually safe to use a simple effort ratio, such as lines of code per staff month, to estimate a new project. Figure 5-5 illustrates the relatively minor difference in linear versus exponential estimates that occurs within a specific size range.
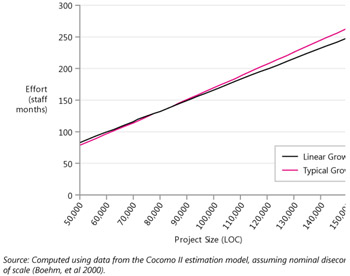
Figure 5-5: Differences between ratio-based estimates and estimates based on diseconomy of scale will be minimal for projects within a similar size range.
If you use a ratio-based estimation approach within a restricted range of sizes, your estimates will not be subject to much error. If you used an average ratio from projects in the middle of the size range, the estimation error introduced by economies of scale would be no more than about 10%. If you work in an environment that experiences higher-than-average diseconomies of scale, the differences could be higher.
| Tip #27 | If you've completed previous projects that are about the same size as the project you're estimating—defined as being within a factor of 3 from largest to smallest— you can safely use a ratio-based estimating approach, such as lines of code per staff month, to estimate your new project. |
Importance of Diseconomy of Scale in Software Estimation
Much of the software-estimating world's focus has been on determining the exact significance of diseconomies of scale. Although that is a significant factor, remember that the raw size is the largest contributor to the estimate. The effect of diseconomy of scale on the estimate is a second-order consideration, so put the majority of your effort into developing a good size estimate. We'll discuss how to create software size estimates more specifically in Chapter 18, "Special Issues in Estimating Size."
[1]The actual number of paths is n x (n — 1) / 2, which is an n2 function.
EAN: 2147483647
Pages: 212
- An Emerging Strategy for E-Business IT Governance
- A View on Knowledge Management: Utilizing a Balanced Scorecard Methodology for Analyzing Knowledge Metrics
- Technical Issues Related to IT Governance Tactics: Product Metrics, Measurements and Process Control
- Governing Information Technology Through COBIT
- Governance in IT Outsourcing Partnerships