7.5 Network Management Mechanisms
7.5 Network Management Mechanisms
We will now take a look at some of the popular management mechanisms, including network management protocols. There are currently two major network management protocols: SNMP and CMIP. CMIP includes CMOT. These network management protocols provide the mechanism for retrieving, changing, and transport of network management data across the network.
SNMP has seen widespread use and forms the basis for many popular commercial and public network management systems. It provides facilities for collecting and configuring parameters from network devices. These are done through the SNMP commands get (to collect the value of a parameter), get-next (to collect the value of the next parameter in the list), and set (to change the value of a parameter). There are also provisions for the unsolicited notification of events, through the use of traps. A trap is a user-configurable threshold for a parameter. When this threshold is crossed, the values for one or more parameters are sent to a specified location. A benefit of trap generation is that polling for certain parameters can be stopped or the polling interval lengthened, and instead an automatic notice is sent to the management system when an event occurs.
Parameters that are accessible via SNMP are grouped into MIBs. Parameters can be part of the standard MIB (MIB-II), other standard MIBs (typically based on a type of network device, technology, or protocol), remote monitoring MIBs, or enterprise-specific MIBs, which have parameters that are specific to a particular vendor's product.
SNMP version 3 (SNMPv3) builds on the previous versions of SNMP, providing more secure authentication, the ability to retrieve blocks of parameters, and trap generation for most parameters. When SNMP is mentioned in this book, it refers to SNMPv3 unless otherwise noted.
CMIP/CMOT provides for parameter collection and setting, as with SNMP, but also allows for more types of operations. Many CMIP/CMOT features, such as globally unique object naming, object classification, alarm reporting, audit trails, and test management, can also be provided by SNMP by creating new MIBs and tools to support such abstractions.
In general, SNMP is simpler to configure and use than CMIP/CMOT, helping make it widely accepted. It is usually easier to instrument network devices with SNMP. SNMP is used in monitoring, instrumentation, and configuration mechanisms, all of which are discussed in the following sections.
7.5.1 Monitoring Mechanisms
Monitoring is obtaining values for end-to-end, per-link, and per-element characteristics. The monitoring process involves collecting data about the desired characteristics, processing some or all of these data, displaying the (processed) data, and archiving a subset of these data.
Data are usually collected through a polling (actively probing network devices for management data) or monitoring process involving a network management protocol (e.g., SNMP) or proxy service. As we will see later in this chapter, several techniques may be used to get this data, as well as to ensure that the data are current and valid. When the data are gathered, they may or may not reflect the characteristics we wish to monitor. Values for some characteristics may have to be derived from the gathered data, and other values may be modified (e.g., added, subtracted, time averaged). This is processing of the data.
Sets of raw (unprocessed) and processed data will need to be displayed. There are different types of displays you may use, including standard monitor displays, field-of-view or wide-screen displays, and special-purpose displays. Along with choosing displays, you will also want to consider how the data will be shown to the user, administrator, or manager. There are several techniques to display data, such as logs and textual displays, graphs and charts (both static and moving), and alarms. Some data may be abstracted by symbols, such as showing parts of the network as a cloud.
At some time during this process, some or all of the data are saved to a (semi) permanent media or system. This part of the process may have multiple steps, including primary storage, the staging of data for short periods, which could be at the network management server; secondary storage, the aggregation of data from multiple primary storage sites, at a storage server for the network; and tertiary storage, which is usually the most permanent—and slowest—storage within the network. Secondary and tertiary storage is often termed storage archives. Figure 7.4 shows each part of this process occurring on a separate device, but they may all be combined on a single device.
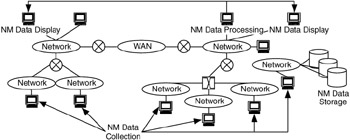
Figure 7.4: Elements of the monitoring process.
Monitoring for Event Notification
An event is something that occurs in the network that is worthy of noting. This may be a problem or failure in a network device, across the network, or when a characteristic crosses a threshold value. It may only be something that is informational to the user, administrator, or manager, such as notification of an upgrade. Events may be noted in a log file, on a display, or by issuing an alarm, depending on the level of priority of the event. Events are similar to transients, which are short-lived changes in the behavior of the network. Thresholds or boundaries may be set on end-to-end, per-link, or per-element characteristics for short-term or immediate notification of events and transients. This is termed here real-time analysis.
Figure 7.5 shows an example of such monitoring. Ping is used to gather round-trip delay information, which is presented as a chart on the monitoring system. A threshold of 100 ms has been chosen for this display. When this threshold is crossed, it triggers an alarm to notify the network manager that a problem may exist in the network.
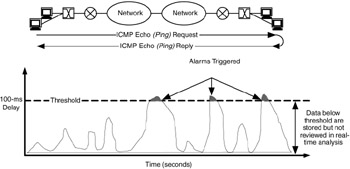
Figure 7.5: Monitoring for event notification.
Real-time analysis usually requires short polling intervals (time periods between active probing of the network and network devices for management data), and there is a trade-off between the number of characteristics and network devices polled for real-time analysis versus the amount of resources (capacity, CPU, memory, storage) needed to support such analysis.
In some cases the amount of network data generated (and the resulting traffic) by the periodic polling of multiple characteristics on many network devices can affect the overall performance of the network. For example, consider a network that has 100 network devices, with each element having an average of four interfaces and each interface being monitored for eight characteristics; this would be added up as follows:
(100 network devices) (4 interfaces/network device) (8 characteristics/interface) = 3200 characteristics
If each of the 3200 characteristics generates an average of 8 bytes of data and an estimated 60 bytes of protocol overhead, the amount of data generated per polling session is as follows:
(3200 characteristics) (8 bytes = 60 bytes) = 217.6 KB of traffic, or 1.74 Mb of traffic
If we plan to poll with a polling interval of 5 seconds, at best this 1.74 Mb of traffic would be spread out over the 5 seconds, or 384 Kb/s. It is more likely, however, that most of the data will arrive shortly after the polls are generated, so the traffic may be more like a spike of 1.74 Mb for the second after the polls occur.
For a period of 1 day, the total amount of traffic will be
(1.75 Mb/polling interval) (720 polling intervals/h) (24 hours/day) = 30.2 Gb of traffic
And the amount of data stored would be
(3200 characteristics/polling interval) (8 bytes) (720 polling intervals/day) (24 hours/day) = 442 MB data stored per day
Over the course of a year, this would add up to more than 161 GB of data. And this is a conservative estimate for a mid-range enterprise environment.
Monitoring for Trend Analysis and Planning
The same end-to-end, per-link, and per-element characteristics that are used for event monitoring can also be used for trend analysis. Trend analysis is using network management data to determine long-term network behaviors, or trends. This is useful in planning for future network growth.
In doing continuous, uninterrupted data collection, usually with long polling intervals (minutes or hours instead of seconds), we can begin by establishing baselines for trends and then use these baselines to plot trend behavior. This is shown in Figure 7.6, which shows long-term trends for availability, delay, and percentage of utilization. Polls for each characteristic are saved to network management on a regular basis, and over a long period (usually weeks or months, but sometimes up to years), trends in these characteristics begin to emerge. In Figure 7.6, upward trends are clearly visible for delay and percentage of utilization.
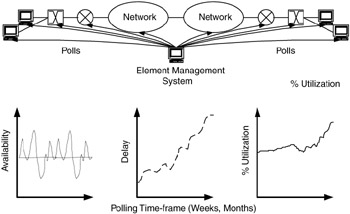
Figure 7.6: Monitoring for metrics and planning.
7.5.2 Instrumentation Mechanisms
Instrumentation is the set of tools and utilities needed to monitor and probe the network for management data. Instrumentation mechanisms include access to network management data via SNMP, monitoring tools, and direct access. Instrumentation can be coupled with monitoring, display, processing, and storage to form a complete management system.
SNMP (currently as version 3) provides access to MIB variables, including those in MIB-II, other standard MIBs (e.g., DS1 MIB), enterprise-specific MIBs, and other monitoring MIBs (remote monitoring [RMON]), switch monitoring, and ATM monitoring). SNMP is the most common method for accessing network management data. Several commercially and publicly available monitoring software packages use SNMP for data access.
Monitoring tools include utilities such as ping, traceroute, and TCPdump, and direct-access mechanisms include telnet, FTP, TFTP, and connections via a console port.
An example of a base set of parameters to monitor can be developed from the standard MIB-II. The following parameters can be collected on a per-interface basis:
| ifInOctets | Number of bytes received |
| ifOutOctets | Number of bytes sent |
| ifInUcastPkts | Number of unicast packets received |
| ifOutUcastPkts | Number of unicast packets sent |
| ifInNUcastPkts | Number of multicast/broadcast packets received |
| ifOutNUcastPkts | Number of multicast/broadcast packets sent |
| ifInErrors | Number of erroneous packets received |
| ifOutErrors | Number of packets that could not be sent |
These parameters can be used for both short-term event monitoring and longterm trend analysis of throughput and error rates. In addition, the following parameter may be collected to determine availability:
| ifOperStatus | State of an interface (up, down, testing) |
This parameter could be used in conjunction with monitoring tools such as ping to verify availability.
In developing the network management architecture, you should collect the instrumentation requirements for each type or class of network device, such as forwarding elements (e.g., routers, switches, hubs), pass-through elements (e.g., DSUs, simple concentrators, simple bridges), and passive devices such as those that use RMON.
A consideration for the network management architecture is to ensure that the instrumentation is accurate, dependable, and simple. There are a couple of ways to ensure accuracy in the instrumentation: testing and taking alternative measurements. If a lab environment is available, some limited network conditions can be replicated and tested. For example, generating known quantities of traffic by devices and/or traffic generators and comparing the results in the routers with those from the devices/traffic generators can test packet-forwarding rates in routers.
Sometimes, parameters can be verified from the current network. Taking alternative measurements of the same parameter at different points in the network is one way to verify parameters. We may be able to get link-layer data from DSUs, routers, and switches in the path of a flow, and by comparing the various sources of data, we can determine whether and where there are discrepancies in parameter measurements.
For a network management system to work properly, the instrumentation needs to be dependable. A network management system is useless if it is the first thing to crash when network problems occur. This may seem obvious, but few current management systems are truly robust and dependable. Ways that dependability can be enhanced in the architecture are to physically separate and replicate the management components. By having multiple systems collecting, processing, displaying, and storing management data for different parts of the network and by building hierarchy in the management data flows, you will make the loss of any single component of the management system have less of an impact on the network's manageability. This is covered in more detail later in this chapter.
7.5.3 Configuration Mechanisms
Configuration is setting parameters in a network device for operation and control of that element. Configuration mechanisms include direct access to devices, remote access to devices, and downloading configuration files (Figure 7.7):
-
SNMP set commands
-
Telnet and command line interface (CLI) access
-
Access via HTTP
-
Access via common object request broker architecture (CORBA)
-
Use of FTP/TFTP to download configuration files
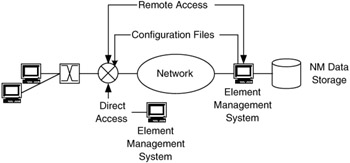
Figure 7.7: Configuration mechanisms for network management.
As part of this process, we want to generate a working set of end-to-end, per-link, and per-element characteristics and plan for the architecture and design to have the facilities to monitor these characteristics at short- and long-term polling intervals. Later in this chapter, we will develop some guidelines on where monitoring facilities should be placed in the network.
Many network devices require some degree of configuration by network personnel. For each type or class of network device (e.g., Brand X router, Ethernet switch), we want to generate a table of configuration parameters, establish the methods for configuring these parameters, and understand the effects of changing each parameter (when possible). To properly manage a network, we must understand how configuration parameters affect each network device.
We also need to understand the effects of problems with network devices and how to correct such problems. Troubleshooting, which consists of problem notification, isolation, identification, and resolution, can be aided by knowing likely failure modes in the network, their effects, and any possible steps to correct them.
It should be noted that, in generating a set of working characteristics, configuration parameters, and failure modes, we are going through a detailed review of how the network will operate. The result is that you will better understand what will happen in the network.
EAN: 2147483647
Pages: 161