Monitoring Tools
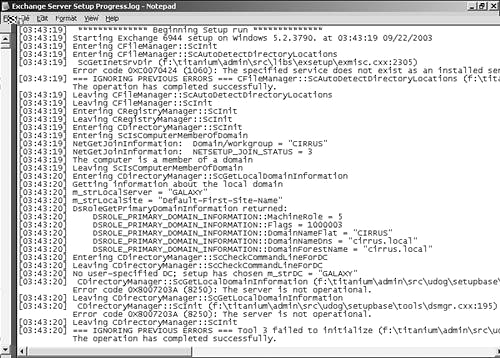
| Exchange 2003 introduces several new or updated tools to help administrators monitor Exchange servers, clients, and message flow. The following sections examine how these tools are configured and used. Server Monitoring ToolsIn terms of monitoring tools for Exchange servers, the first tool you will probably come across is the new Exchange 2003 Setup Log. This log is generated whenever you install an Exchange server. You can use the log to troubleshoot Exchange installations. After you run the Exchange setup, the log is created in the root drive of the server. The log file is named Exchange Server Setup Progress.log and should look something like the log file shown in Figure 6.1. Figure 6.1. Exchange Server setup log.
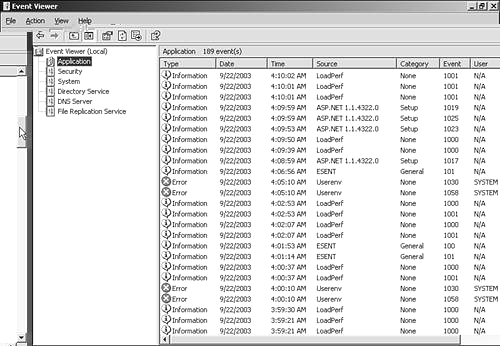
From this log, you can see what installation tasks were attempted or completed during the setup process. This logging provides a running narrative of what has occurred. If you experience problems with the setup process, you should scan the setup narrative to determine where the error occurred. The setup log is also handy when you're trying to troubleshoot silent installations. That's because the setup log is generated regardless of whether the setup was run in attended or unattended mode. In addition to the Exchange setup log, any errors that were generated during the setup process are shown in the setup user interface. With previous versions of Exchange, these errors might have been shown during the setup process. With Exchange 2003, these errors are consolidated and can be shown together. This consolidated error reporting allows you to quickly fix a number of problems at the same time, which is especially handy when you're working with prerequisites for installing Exchange. The error reporting displays all the missing prerequisite components in a single dialog box. In addition to the setup log and any error messages that are generated, the setup program writes an entry to the Windows Event Log indicating that the setup has run successfully. The Event Log also holds entries for other Exchange tasks and actions, including critical errors that occur. As you administer Exchange, you can use the Event Log to provide a look behind the scenes to see what services have started, stopped, and so on. The log also can provide additional information about critical errors that halt Exchange services. Three distinct types of Event Logs are available in Windows: Application, Security, and System logs. Application logs contain the most information from Exchange, including notification that a setup has completed successfully, information about any stopped services, and so on. In contrast, the Security and System logs provide information about ancillary services or components that might affect Exchange performance. To view and print the Windows Event Logs and events that are specific to Exchange Server 2003, follow these steps:
You can utilize this list to monitor Exchange and use the events listed to help troubleshoot any Exchange errors that might occur. Another handy feature in the Exchange administrator's toolbox is the new-and-improved error reporting for Exchange 2003. You might already be familiar with the Windows error-reporting services. Whenever a critical error occurs, you are prompted to send a description of this error to Microsoft. This helps the product and development teams effectively track bugs and critical errors, but what about helping Exchange administrators? Often, the critical errors that occur are known issues with Exchange and require an Exchange administrator to review the error and determine the most appropriate solution (such as a configuration change, a hot fix, or a service pack). To make Exchange server administration a bit easier, Exchange 2003 supports Corporate Error Reporting (CER). Exchange has improved on the CER functionality found in Exchange 2000. CER is the Microsoft toolset for collecting error reports created by the Microsoft Windows Error Reporting client. You can use the information collected to help troubleshoot and correct fatal errors that occur. Similar to the way error reports are returned to Microsoft, errors are documented with CER, and this information is sent to a shared directory. Administrators can then use this information to view and categorize errors to help troubleshoot and correct configuration problems or bugs within Exchange. CORPORATE ERROR REPORTING For more information on installing and configuring the CER tools, check out http://www.microsoft.com/resources/satech/cer. In addition to the error reporting service, Exchange 2003 has a number of new tools and methods for monitoring Exchange servers and clients that connect to and interact with Exchange. This monitoring capability is provided through the Microsoft Operations Manager (MOM), which is a separate server-based tool used to monitor and manage Microsoft enterprise servers. As an Exchange administrator, you might have worked with MOM before. There was a Management Pack available for Exchange 2000, but with the release of Exchange 2003, this pack has been updated to include several new Exchange attributes or areas to be monitored. MICROSOFT OPERATIONS MANAGER For more information on licensing, installing, and configuring MOM, check out http://www.microsoft.com/exchange/techinfo/administration/2003.asp. Client Monitoring ToolsMOM and the related Exchange Server Management Pack have been updated to include Exchange client-specific attributes that can be monitored. The attributes include the following:
In addition to the MOM tools that monitor Exchange servers and clients, you can use the tools found within the Office Resource Kit to monitor Outlook errors using the same technology found in the CER service. |
EAN: 2147483647
Pages: 109