Chapter 5: Troubleshooting TCPIP
![]() Download CD Content
Download CD Content
Transmission Control Protocol/Internet Protocol (TCP/IP) is the basic data transfer protocol of the Internet. TCP/IP is also used for data transmission over private networks, such as intranets and extranets. When a network connection is established using TCP/IP, TCP divides a stream of data into fixed size data packets while IP provides IP addresses to each data packet. When the data packets are received at the destination, IP arranges the data packets as per their IP addresses, and TCP converts the fixed size data packets into a stream of data. There can be instances when there are connectivity problems in a network connection. For example, the source computer is unable to establish connection or data packets are not received at the destination computer due to hardware failure. You may use troubleshooting tips and techniques pertaining to TCP/IP networks in these situations.
This chapter discusses the various TCP/IP router diagnostic tools, such as the ping, trace, show, and debug commands. These tools are also referred to as diagnostic commands. We will also discuss the troubleshooting techniques that are followed in TCP/IP networks.
TCP/IP Router Diagnostic Tools
There are four major diagnostic commands that are executed on Cisco routers for troubleshooting TCP/IP network problems. These are:
-
ping
-
trace
-
show
-
debug
Ping
The ping command is a diagnostic tool to test the connectivity of hosts in the TCP/IP network. This command also isolates TCP/IP network problems. For example, if there is a connectivity related problem in a TCP/IP network, you can execute a ping command. The hosts that do not respond to the command indicate that there is a connectivity problem. The administrator can now concentrate only on the hosts that are not responding. The process of executing a ping command is depicted in Figure 5.1.
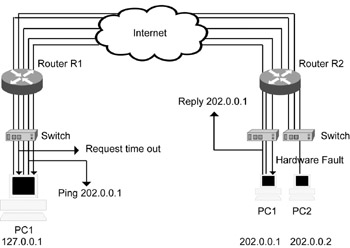
Figure 5.1: Testing TCP/IP network connectivity using the ping command.
In Figure 5.1, the ping packet from PC1 with IP address 127.0.0.1 is sent to PC2 with IP address 202.0.0.2. However, the ping packet is not able to reach PC2 due to a hardware fault in the switch of PC2. As a result, a request timed out message is sent back to PC1. A ping packet is also sent from PC1 having IP address 127.0.0.1 to PC1 having IP address 202.0.0.1, which in turn sends a reply to the sender PC1.
The ping command sends a fixed 32-byte packet to the host for testing the network connectivity. This packet is an Internet Control Message Protocol (ICMP) echo packet. When the host receives an ICMP echo packet, it replies by echoing the packet back to the source. The connectivity of the host is tested in this manner. Cisco provides two modes to execute the ping command: the user exec mode and privilege exec mode.
Ping Command in the User Exec Mode
The user exec mode is used to perform a simple TCP/IP network connectivity test. This mode is for users who do not have administrator rights. The syntax of the ping command in user exec mode is:
Ping [Protocol] (Host name | Host address)
Different parameters of the ping command in the user exec mode are:
Protocol: Identifies the protocol for executing a ping command. IP is the default protocol. However, other protocols, such as IPX and AppleTalk, can be specified.
Host Name: Identifies the destination computer. The IP address of the destination computer is found using the Domain Name System (DNS).
Address: Identifies the IP address of the system to ping.
Listing 5.1 shows a sample output of the ping command in the user exec mode.
Listing 5.1 Sample Output of ping Command in the User Exec Mode
texas# texas# texas#ping 192.12.1.10 Type escape sequence to abort. Sending 5, 100-byte ICMP Echoes to 192.12.1.10, timeout is 2 seconds: !!!!! Success rate is 100 percent (5/5), round-trip min/avg/max = 1/2/4 ms texas# texas# texas#
In Listing 5.1, output of the ping command displays some characters, such as ! and ?. Each character has a unique description, as listed in Table 5.1.
| Character | Description |
|---|---|
| ! | Indicates receipt of echo reply packet. |
| . | Indicates that the network server timed out while expecting reply packet. |
| U | Indicates that the destination host is unreachable. |
| N | Indicates that network is unreachable. |
| P | Indicates that protocol is unreachable. |
| Q | Indicates a source quench message sent by the destination computer or an Internet gateway as a request to the source computer to diminish the rate of sending data packets. This message is sent when the destination computer or an Internet gateway receives data packets at a rate greater than their processing speed. |
| M | Indicates the inability to fragment. |
| ? | Indicates an unknown packet type. |
ping Command in the Privilege Exec Mode
The privilege exec mode is also known as an extended ping and is used to perform a detailed check of TCP/IP network connectivity. Only administrators can enter into the privilege exec mode. To enter this mode, type the enable command at the user prompt. The syntax is
hostname> enable hostname#
in which hostname> shows the user exec mode. Different parameters of the ping command in the privilege exec mode are:
Protocol [ip]: Indicates that the default protocol is IP.
Target IP address: Prompts to enter the IP address or the hostname of destination system.
Repeat count [5]: Prompts to enter the number of packets to be sent to the destination system. By default, five packets are sent.
Datagram size [100]: Prompts to enter the size of a packet in bytes to ping. The default packet size is 100 bytes.
Timeout in seconds [2]: Prompts to enter the timeout interval. The default timeout interval is 2 seconds.
Extended commands [n]: Prompts to specify any extended command, such as the data pattern and header options. To specify extended commands, enter “Yes.” However, the default value is “No.”
Listing 5.2 shows a sample output of the ping command in the privilege exec mode.
Listing 5.2 Sample Output of the ping Command in the Privilege Exec Mode
texas# texas# texas# texas#ping Protocol [ip]: Target IP address: 201.16.1.2 Repeat count [5]: Datagram size [100]: Timeout in seconds [2]: Extended commands [n]: Type escape sequence to abort. Sending 5, 100-byte ICMP Echos to 201.16.1.2, timeout is 2 seconds: !!!!! Success rate is 100 percent (5/5), round-trip min/avg/max = 1/2/4 ms texas# texas# texas# texas# texas#
The sample output of the ping command when “Yes” is entered in the Extended commands [n] field is as shown in Listing 5.3.
Listing 5.3 Output of the ping Command
texas# texas# texas#ping Protocol [ip]: Target IP address: 192.12.1.93 Repeat count [5]: Datagram size [100]: Timeout in seconds [2]: Extended commands [n]: y Source address or interface: 192.12.1.2 Type of service [0]: Set DF bit in IP header? [no]: Validate reply data? [no]: Data pattern [0xABCD]: Loose, Strict, Record, Timestamp, Verbose[none]: r Number of hops [ 9 ]: Loose, Strict, Record, Timestamp, Verbose[RV]: Sweep range of sizes [n]: Type escape sequence to abort. Sending 5, 100-byte ICMP Echoes to 192.12.1.93, timeout is 2 seconds: Packet has IP options: Total option bytes= 39, padded length=40 Record route: 0.0.0.0 0.0.0.0 0.0.0.0 0.0.0.0 0.0.0.0 0.0.0.0 0.0.0.0 0.0.0.0 0.0.0.0 Reply to request 0 (1 ms). Received packet has options Total option bytes= 40, padded length=40 Record route: 192.12.1.2 192.12.0.13 192.12.12.1 192.12.1.93 192.12.0.14 192.12.0.21 192.12.1.2 * 0.0.0.0 0.0.0.0 End of list Reply to request 1 (4 ms). Received packet has options Total option bytes= 40, padded length=40 Record route: 192.12.1.2 192.12.0.13 192.12.12.1 192.12.1.93 192.12.0.14 192.12.0.21 192.12.1.2 * 0.0.0.0 0.0.0.0 End of list Reply to request 2 (4 ms). Received packet has options Total option bytes= 40, padded length=40 Record route: 192.12.1.2 192.12.0.13 192.12.12.1 192.12.1.93 192.12.0.14 192.12.0.21 192.12.1.2 * 0.0.0.0 0.0.0.0 End of list Reply to request 3 (1 ms). Received packet has options Total option bytes= 40, padded length=40 Record route: 192.12.1.2 192.12.0.13 192.12.12.1 192.12.1.93 192.12.0.14 192.12.0.21 192.12.1.2 * 0.0.0.0 0.0.0.0 End of list Reply to request 4 (1 ms). Received packet has options Total option bytes= 40, padded length=40 Record route: 192.12.1.2 192.12.0.13 192.12.12.1 192.12.1.93 192.12.0.14 192.12.0.21 192.12.1.2 0.0.0.0 0.0.0.0 End of list Success rate is 100 percent (5/5), round-trip min/avg/max = 1/2/4 ms texas# texas# texas#
The ping command is the most useful command for testing the connectivity between hosts and routers in TCP/IP networks.
Trace
The trace command is a diagnostic tool that traces the path between two hosts to locate any connectivity problems. The syntax of the trace command is
trace [Host name | Host address]
The parameters of the trace command are:
Host name: Specifies host name to trace.
Host address: Specifies host address to trace.
When a trace command is executed, the following taks are performed:
-
The source host sends a packet to the local router with time-to-live (TTL) value set to 1.
-
The local router discards the packet and sends an ICMP packet with time exceeded back to the source host.
-
The source host resends additional packets with increased TTL values.
Three steps are repeated to generate a list of routers, as well as the path and time taken to reach those routers. Three probes are generated for every TTL value, and in case a response is not received within a certain time interval, the output is an asterisk, indicating that the destination host was unreachable. The trace command ends when:
-
The destination host replies on receipt of the packet.
-
The maximum TTL value of 30 is exceeded.
-
A user interrupts the trace command by using the escape sequence.
Listing 5.4 shows a sample output of the trace command.
Listing 5.4 Sample Output of the trace Command
texas# texas# texas# texas# texas# texas# texas#trace ip 201.16.1.2 "Type escape sequence to abort." Tracing the route to 201.16.1.2 1 1.1.1.2 0 msec 16 msec 0 msec 2 5.5.5.6 20 msec 16 msec 16 msec 3 201.16.1.2 20 msec 16 msec * texas# texas# texas# texas# texas#
| Note | The * character indicates that the source host has reached timeout. |
Show Commands
The show command is a diagnostic tool to determine the exact cause of a performance slowdown in a TCP/IP network. Cisco IOS provides a range of show commands that display information about the rate of utilization of router resources, network interface status, and router configurations. The show commands can be executed in both the user and privilege modes.
Table 5.2 lists several show commands supported by Cisco.
| Command | Description |
|---|---|
| access-lists | List access lists |
| arp | ARP table |
| cdp | CDP information |
| clock | Display the system clock |
| configuration | Contents of nonvolatile memory |
| controllers | Interface controller status |
| flash | Display information about the flash filesystem |
| frame-relay | Frame-Relay information |
| history | Display the session command history |
| hosts | IP domain name, nameservers, and host table |
| interfaces | Interface status and configuration |
| ip | IP information |
| ipx | Novell IPX information |
| isdn | ISDN information |
| ntp | Network time protocol |
| protocols | Active network routing protocols |
| running-config | Current operating configuration |
| sessions | Information about Telnet connections |
| startup-config | Contents of startup configuration |
| terminal | Display terminal configuration parameters |
| users | Display information about terminal lines |
| version | System hardware and software status |
Show ip Route
This command displays records in the IP routing table. An IP routing table stores all the IP routes and their corresponding information.
Listing 5.5 shows a sample output of the show ip route command without specifying any IP address.
Listing 5.5 Sample Output of the show ip route Command
texas# texas# texas#show ip route Codes: C - connected, S - static, I - IGRP, R - RIP, M - mobile, B - BGP D - EIGRP, EX - EIGRP external, O - OSPF, IA - OSPF inter area E1 - OSPF external type 1, E2 - OSPF external type 2, E - EGP i - IS-IS, L1 - IS-IS level-1, L2 - IS-IS level-2, - candidate default U - per-user static route Gateway of last resort is not set C 172.16.0.0/16 is directly connected, 172.16.1.1 C 1.0.0.0/8 is directly connected, 1.1.1.1 R 192.16.1.0/24 [120/1] via 1.1.1.2, 00:06:19, Serial0 texas# texas# texas#
This output shows the routing table database. Networks connected with C are directly connected to the router, and R shows the networks learned by the routing protocol RIP.
You can also specify an IP address in the show ip route command to display detailed information, such as the network source interface.
Listing 5.6 shows a sample output of the show ip route command with a specified IP address.
Listing 5.6 Sample Output of the show ip route Command
texas# texas# texas#show ip route 192.12.50.0 Routing entry for 192.12.50.0/24 Known via "eigrp 100", distance 90, metric 2195456, type Internal Redistributing via eigrp 100 Last update from 192.12.30.6 on Serial1, 00:02:03 ago Routing Descriptor Blocks: *192.12.30.6, from 192.12.30.6, 00:02:03 ago, via Serial1 Route metric is 2195456, traffic share count is 1 Total delay is 21000 microseconds, minimum bandwidth is 1544 Kbit Reliability 128/255, minimum MTU 1500 bytes Loading 1/255, Hops 1 texas#
Show ip ospf Database
This command displays detailed information regarding Open Shortest Path First (OSPF) ports and interfaces. The output of the show ip ospf command depends on the specified keyword. For example, when a router keyword is specified, information regarding router link states is displayed. Similarly, when the network keyword is specified, information regarding network link states is displayed.
Listing 5.7 shows a sample output of the show ip ospf command.
Listing 5.7 Sample Output of the show ip ospf Command
texas# texas# texas# texas# texas# texas# texas# texas#show ip ospf database OSPF Router with ID (172.16.1.1) (Process ID 10) Router Link States (Area 0) Link ID ADV Router Age Seq# Checksum Link count 1.1.1.2 1.1.1.2 146 0x80000003 0x9084 1 Net Link States (Area 0) Link ID ADV Router Age Seq# Checksum 1.1.1.2 1.1.1.2 146 0x80000003 0x9084
Show ip ospf Interface
This command displays information regarding the interfaces on which OSPF is running. Listing 5.8 shows a sample output of the show ip ospf interface command.
Listing 5.8 Sample Output of the show ip ospf interface Command
texas# texas# texas# texas#show ip ospf interface Serial0 is up, line protocol is up Internet Address 1.1.1.1/8 , Area 0 Process ID 10, Router ID 172.16.1.1, Network Type BROADCAST, Cost: 64 Transmit Delay is 1 sec, State DR, Priority 1 Designated Router (ID) 172.16.1.1, Interface address 1.1.1.1 Backup Designated router (ID) 1.1.1.2, Interface address 1.1.1.1 Timer intervals configured, Hello 10, Dead 40, Wait 40, Retransmit 5 Hello due in 00:00:02 Neighbor Count is 1, Adjacent neighbor count is 1 Adjacent with neighbor 1.1.1.2 (Backup Designated Router) Suppress hello for 0 neighbor (s) Ethernet0 is up, line protocol is up Internet Address 172.16.1.1/16, Area 0 Process ID 10, Router ID 172.16.1.1, Network Type BROADCAST, Cost: 10 Transmit Delay is 1 sec, State DR, Priority 1 Designated Router (ID) 172.16.1.1, Interface address 172.16.1.1 Backup Designated router (ID) 1.1.1.2, Interface address 172.16.1.1 Timer intervals configured, Hello 10, Dead 40, Wait 40, Retransmit 5 Hello due in 00:00:02 Neighbor Count is 1, Adjacent neighbor count is 1 Adjacent with neighbor 1.1.1.2 (Backup Designated Router) Suppress hello for 0 neighbor(s) texas#
Show ip ospf Neighbor
This command is used to display information regarding the neighboring routers. Listing 5.9 shows a sample output of the show ip ospf neighbor command.
Listing 5.9 Sample Output of the show ip ospf neighbor Command
texas# texas# texas# texas# texas# texas# texas# texas# texas# texas#show ip ospf neighbor Neighbor ID Pri State Dead Time Address Interface 192.16.16.1 1 FULL/ 00:00:02 1.1.1.2 Serial0 texas# texas# texas# texas# texas# texas#
Show ip Access-list
This command is used to display information regarding specific or all current IP access lists in the 1 to 99 range. This information enables you to troubleshoot problems due to access or security settings.
Listing 5.10 shows a sample output of the show ip access-list command.
Listing 5.10 Sample Output of the show ip access-list Command
texas# texas# texas# texas# texas# texas# texas#show ip access-list Extended IP access list 105 105 deny tcp any any eq 23 (0 matches) 105 permit ip any any 21 (0 matches) Extended IP access list 101 105 deny tcp any any eq 23 (0 matches) 101 permit tcp any any eq 20 (0 matches) 101 permit tcp any any eq 21 (0 matches) texas# texas# texas# texas#
Show ip arp
This command displays information, such as the IP address and encapsulation type, present in the router’s Address Resolution Protocol (ARP) cache.
Listing 5.11 shows a sample output of the show ip arp command.
Listing 5.11 Sample Output of the show ip arp Command
texas# texas# texas# texas# texas# texas#show ip arp Protocol Address Age(min) Hardware Addr Type Interface Internet 172.16.1.1 - 000C.4684.6106 ARPA Ethernet0 Internet 172.16.1.2 1 000C.8730.4419 ARPA Ethernet0 texas# texas# texas# texas# texas# texas# texas# texas# texas#
In Listing 5.11, a hyphen in the Age field indicates that the address is local. In addition, ARPA in the Type field indicates that the encapsulation type is Ethernet. SNAP in this field indicates that the encapsulation type is RFC 1042, and SAP indicates that the encapsulation type is IEEE 802.3.
Show ip Protocols
This command displays information, such as route redistribution, regarding IP routing protocols that are executed via the router.
Listing 5.12 shows a sample output of the show ip protocols command.
Listing 5.12 Sample Output of the show ip protocols Command
texas#show ip protocols Routing Protocol is "rip" Sending updates every 30 seconds, next due in 26 seconds Invalid after 180 seconds, hold down 180, flushed after 240 Outgoing update filter list for all interfaces is Incoming update filter list for all interfaces is Redistributing: rip Default version control: send version 1, receive any version Interface Send Recv Key-chain Serial0 1 1 2 Ethernet0 1 1 2 Routing for Networks: 172.16.0.0 1.0.0.0 Routing Information Sources: 1.1.1.1 120 00:00:00 Distance: (default is 120)
Show ip Traffic
This command displays information collected by a router regarding the IP traffic.
The output of this command is organized as per the IP protocol and is shown in Listing 5.13.
Listing 5.13 Sample Output of the show ip traffic Command texas#
texas# texas#show ip traffic IP statistics: Rcvd: 500 total, 500 local destination 0 format errors, 0 checksum errors, 0 bad hop count 0 unknown protocol, 0 not a gateway 0 security failures, 0 bad options, 0 with options Opts: 0 end, 0 nop, 0 basic security, 0 loose source route 0 timestamp, 0 extended security, 0 record route 0 stream ID, 0 strict source route, 0 alert, 0 cipso 0 other Frags: 0 reassembled, 0 timeouts, 0 couldn't reassemble 0 fragmented, 0 couldn't fragment Bcast: 38 received, 52 sent Mcast: 390 received, 393 sent Sent: 396 generated, 0 forwarded 0 encapsulation failed, 0 no route ICMP statistics: Rcvd: 0 format errors, 0 checksum errors, 0 redirects, 0 unreachable 0 echo, 0 echo reply, 0 mask requests, 0 mask replies, 0 quench 0 parameter, 0 timestamp, 0 info request, 0 other 0 irdp solicitations, 0 irdp advertisements Sent: 0 redirects, 0 unreachable, 0 echo, 0 echo reply 0 mask requests, 0 mask replies, 0 quench, 0 timestamp 0 info reply, 0 time exceeded, 0 parameter problem 0 irdp solicitations, 0 irdp advertisements UDP statistics: Rcvd: 0 total, 0 checksum errors, 0 no port Sent: 0 total, 0 forwarded broadcasts TCP statistics: Rcvd: 0 total, 0 checksum errors, 0 no port Sent: 0 total Probe statistics: Rcvd: 0 address requests, 0 address replies 0 proxy name requests, 0 where-is requests, 0 other Sent: 0 address requests, 0 address replies (0 proxy) 0 proxy name replies, 0 where-is replies EGP statistics: Rcvd: 0 total, 0 format errors, 0 checksum errors, 0 no listener Sent: 0 total IGRP statistics: Rcvd: 0 total, 0 checksum errors Sent: 0 total OSPF statistics: Rcvd: 0 total, 0 checksum errors 0 Hello, 0 database desc, 0 link state req 0 link state updates, 0 link state acks Sent: 0 total IP-IGRP2 statistics: Rcvd: 402 total Sent: 406 total PIMv2 statistics: Sent/Received Total: 0/0, 0 checksum errors, 0 format errors Registers: 0/0, Register Stops: 0/0 IGMP statistics: Sent/Received Total: 0/0, Format errors: 0/0, Checksum errors: 0/0 Host Queries: 0/0, Host Reports: 0/0, Host Leaves: 00 DVMRP: 0/0, PIM: 0/0 ARP statistics: Rcvd: 0 requests, 0 replies, 0 reverse, 0 other Sent: 1 requests, 5 replies (0 proxy), 0 reverse texas# texas# texas#
Debug Commands
The debug commands are diagnostic tools used to collect detailed information while diagnosing a facility, task, or protocol. However, debugging commands should be used only if needed, because most of the debugging commands require every packet to be scanned by the route processor. This causes additional overhead on the router.
The significant debug command used for debugging TCP/IP networks is debug ip rip.
Debug ip rip
This command displays information regarding Routing Information Protocol (RIP) transactions, such as updates of a routing table, that are sent by a serial interface, as shown in Listing 5.14.
Listing 5.14 Sample Output of the debug ip rip Command
texas#debug ip rip RIP protocol debugging is on RIP: received update from 1.1.1.2 on Serial0 192.16.1.0 in 1 hops RIP: sending update to 255.255.255.255 via Serial0 (1.1.1.1) subnet 172.16.0.0, metric 1 RIP: sending update to 255.255.255.255 via Ethernet0 (172.16.1.1) subnet 1.0.0.0, metric 1 subnet 192.16.1.0, metric 2 RIP: received update from 1.1.1.2 on Serial0 192.16.1.0 in 1 hops RIP: sending update to 255.255.255.255 via Serial0 (1.1.1.1) subnet 172.16.0.0, metric 1 RIP: sending update to 255.255.255.255 via Ethernet0 (172.16.1.1) subnet 1.0.0.0, metric 1 subnet 192.16.1.0, metric 2 RIP: received update from 1.1.1.2 on Serial0 192.16.1.0 in 1 hops RIP: sending update to 255.255.255.255 via Serial0 (1.1.1.1) subnet 172.16.0.0, metric 1
Debug ip icmp
The debug ip icmp command enables you to determine if the router is sending and receiving ICMP messages. ICMP messages can include redirect or network unreachable messages. This command is used to troubleshoot end-to-end connectivity problems.
Debug ip packet
The debug ip packet command displays all the IP debugging information and IP security options. The IP debugging information includes packets received, generated, and forwarded. In addition, use this command to analyze messages sent from the local host to the remote host or vice versa while troubleshooting an end-to-end connection problem within a network.
Debug arp
The debug arp command checks the flow of data at the ARP. This command is used in a TCP/IP network when some nodes respond and some nodes do not. For this, the debug arp command checks if the router is sending or receiving ARP requests and replies.
EAN: 2147483647
Pages: 130