15.2. Grouping Timesavers So far, you've learned how to tame an intimidating worksheet and neatly organize it into groups. Why stop there? This section covers a few other tools that, along with the grouping tools you've just mastered, will make your life easier. These tools include automatic outlining and subtotaling (both of which can create data groups automatically). 15.2.1. Auto Outline Adding groups to a large worksheet can be tedious . You can leap over that tedium in a single bound with Auto Outline, a feature that gets Excel to examine your worksheet and then create all the column and row groups you need automatically. Like most automatic features, Auto Outline is a great solution when it works, and it's absolutely no help the rest of the time. Automatic outlining is an all-or-nothing affair, giving you either a grouped worksheet or the unhelpful error message, "Cannot create an outline". You also don't have any ability to configure how many levels of nesting Excel uses, how many groups it creates, and whether it creates column groups, row groups, or both. With a bit of planning, however, you can set up your worksheets so they're Auto Outline-friendly. Here are the key points. Excel makes all its guesses about how to implement Auto Outline based on any formulas it finds that give it clues about the structure of your worksheet. If you have a formula that uses SUM( ) to total the cells in multiple columns in the same row, Excel assumes that it can place these columns in a single group so that you can collapse the details and leave just the totals visible. If Excel finds a formula that uses the data in the rows above it, the program assumes that a row group 's in order. In other words, Auto Outline requires formulas to determine the grouping levels it should add. If you don't use any summary formulas at all, the Auto Outline feature doesn't work.
Note: If you don't have any formulas at all on your worksheet, you're guaranteed that Excel can't create an outline.
To use automatic outlining, select the portion of the worksheet that you want to outline, and then choose Data  Outline Group Auto Outline. Generally, its easiest to select the whole worksheet (click the square just outside the top-left corner of the worksheet) to apply grouping to all your data at once. Outline Group Auto Outline. Generally, its easiest to select the whole worksheet (click the square just outside the top-left corner of the worksheet) to apply grouping to all your data at once. If you don't like the results, you can't undo the outlining operation, but you can remove all the groups from your worksheet by choosing Data Outline Group Clear Outline. 15.2.2. Automatic Subtotaling Auto Outline isn't the only outlining trick that Excel has up its sleeve. The Subtotal tool lets you create groups and subtotals all in one clicka feature that can save you scads of time. To use automatic subtotaling, you need to have a long table of repetitive data (product catalogs, sales transactions, calorie -counting meals on the Atkins plan). You can't use more than one tableinstead, the goal is to get Excel to break your table into summarized subtables for you. Each table gets its own subtotal (for any or all of the columns that you choose) and all the subtotals get added together for your very own Grand Total. To subtotal and outline your data simultaneously , follow these steps: -
Sort your data so that the rows you want to group are together in the list . Before subtotaling your data, you may need to sort it into the right order. If you have a list of products and you want to subtotal the product information by category, you need to sort the table by category before you begin. This step ensures that all the products in each category are grouped together. For detailed information about sorting, see Section 14.2.1. -
Once you have the list in the correct order, select the range of cells that contains the list . Usually, the easiest option is to select each of the columns in your list by dragging across the column headers. -
Choose Data Outline Subtotal . The Subtotals dialog box appears. -
In the "At each change in" pop-up menu, choose the field under which you want the subtotal to appear. The menu provides a list with all the column titles in your selection . If, say, you wanted to group together (and create subtotals for) products that have the same Category label (as shown in Figure 15-12), you'd choose Category. Excel inserts a subtotal row each time the category label changes. (In the figure, the Communication products subtotal first, the Deception products next, and so on.) In order for this process to work, the list must be sortedas you did in step 1so that all records with the same category are already next to each other. -
In the "Use function" pop-up menu, choose the function you want to use to calculate the subtotal information . This list includes everything supported by the SUBTOTAL( ) function, including averages, counts, and subtotals. Unfortunately, you can't total different columns using different functions. 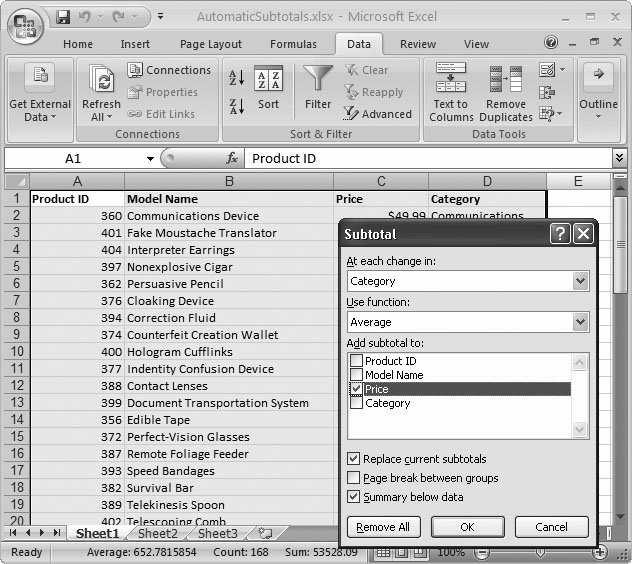 | Figure 15-12. This worksheet has a long list of product data that's about to be subtotaled. Excel creates the subtotals for each group of products that has a different label in the Category column. The subtotal row includes the average price of the products in each group. | | -
The "Add subtotal to" list includes all the column names in your selection. Put a checkmark next to each column you want to generate a subtotal for . To calculate the subtotals, Excel uses the function you chose in step 5. -
If you want to start each group on a new page, turn on the "Page break between groups" checkbox . This option works well if you have large groups, and you want to separate them in a printout. -
If you want to display the summary information at the end of group, choose "Summary below data." Otherwise, the totals appear at the beginning of the group . If you're dividing products into category groups, choose "Summary below data" to make sure you'll see the listing of products, followed by the subtotal row. -
Click OK to group and subtotal the data . Excel inserts a row in between each group, where it adds the formulas that calculate the subtotals for the group (Figure 15-13). All of the formulas use the SUBTOTAL( ) function. Excel also calculates grand totals for all the subtotals that it's generated. 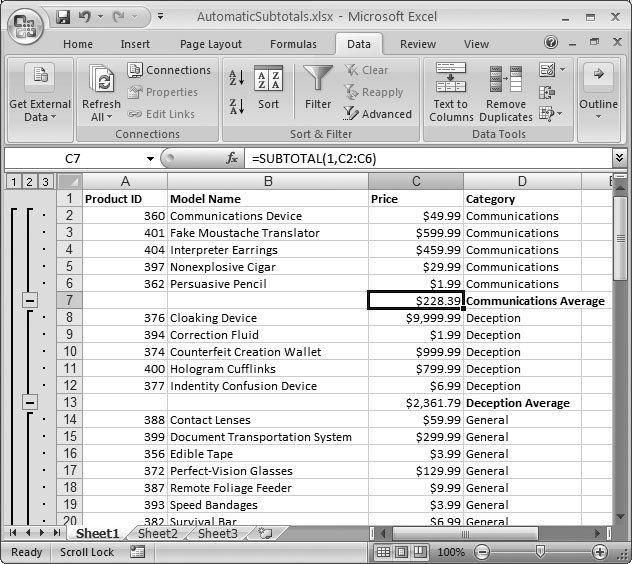 | Figure 15-13. The product list, with subtotaling applied. Rows 7 and 13 contain the newly calculated subtotals. Excel has also added a grand total at the bottom of the list (which isn't shown in this figure). | | If you want to remove subtotals, you have two choices. The easiest approach is to choose Data Outline Subtotals to open the Subtotals dialog box, and then click the Remove All button. Alternatively, you can replace the existing subtotals with new subtotals. To do this, choose different options in the Subtotal dialog box, and make sure the "Replace current subtotals checkbox is turned on. |