Chapter 8. Creating Reports
8. Creating Reports
There are many reasons to create a hard copy of your lovingly maintained Access data. With a good printout, you can:
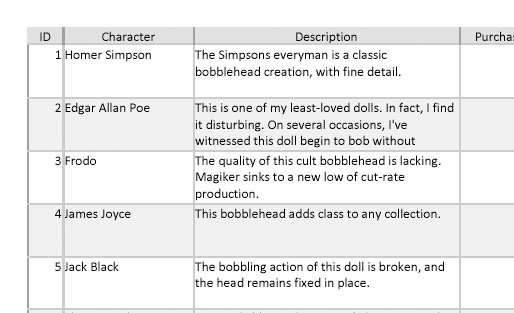
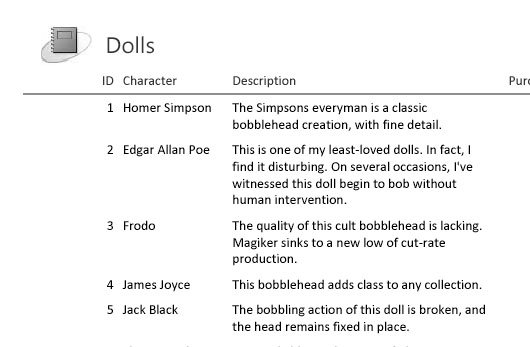
In Chapter 3 you learned how to print the raw data that's in a table, straight from the datasheet. This technique is handy, but it provides relatively few features. You don't have the flexibility to deal with large blocks of information, you can't fine-tune the formatting of different fields, and you don't have tools like grouping and summarizing that can make the information easier to understand. As you've probably already guessed, Access provides another printing feature that fills in these gaps. It's called reports , and it allows you to create a fine- tuned blueprint that tells Access exactly how it should prepare your data for the printer. Reports are specialized database objects, much like tables and queries. As a result, you can prepare as many reports as you need, and keep them on hand indefinitely. Life isn't as easy if you stick to the datasheet alone. For example, if you're using the bobblehead database, you may want to print a list of bobblehead dolls with the doll's name and manufacturer information for your inventory list, and a separate list with prices for your budgeting process. To switch back and forth between these two types of printouts using the datasheet, you have to manually rearrange and hide columns every time . Reports don't suffer from this problem, because each report is saved as a separate database object. So if you want to print your inventory list, you simply run the DollInventory report. If you want the budgeting details, you fire up the Doll-Prices report. To see one reason why reports are insanely better than ordinary datasheet printouts, compare Figure 8-1 (which shows a datasheet printout) and Figure 8-2 (which puts the same data into a simple report). Notice how the datasheet printout has both wasted space and missing information.
|
EAN: N/A
Pages: 85