Section 11.6. Grouping
11.6. GroupingGrouping's an indispensable tool for making sense of large volumes of data by arranging them into smaller groups. You can then perform calculations on each individual group. Consider a list of orders in the Boutique Fudge company. Depending on how you want to group your data, you can consider whether chocolate milk outsells chocolate beer, whether customers in New York crave more cocoa than those in Alabama, and so on. You have three ways to use grouping to analyze information in a report:
Note: Subreports are largely a holdover from earlier versions of Access. In Access 2007, the grouping features have improved so much that you no longer need subreports. In this book, you'll focus on getting the most from report grouping, and bypass subreports. 11.6.1. Report GroupingTo create groups, follow these steps:
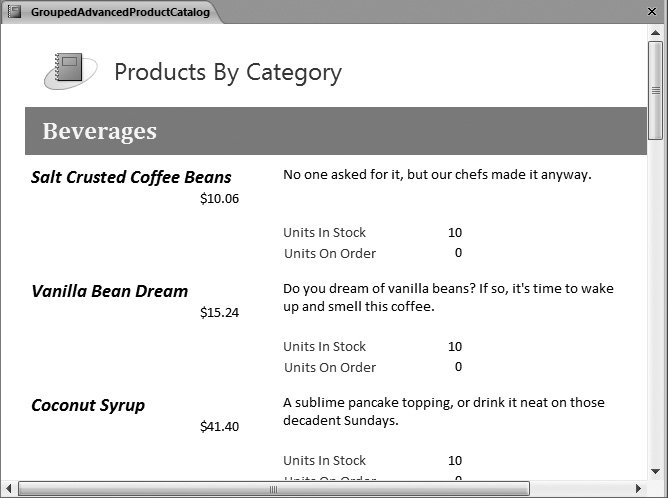
Tip: When you use grouping, it may not make sense to keep your column headers in the page layout section. That's because every group header interrupts your table. Often, you're better off placing the column headers at the bottom of the group header, so they appear at the beginning of every group (not at the top of every page). Figure 11-18 uses this approach. (Figure 11-19 doesn't need to, because it doesn't use any headers at all.) Unfortunately, in order to use this more attractive arrangement, you need to remove your fields from their automatic layout (Section 11.1.3).
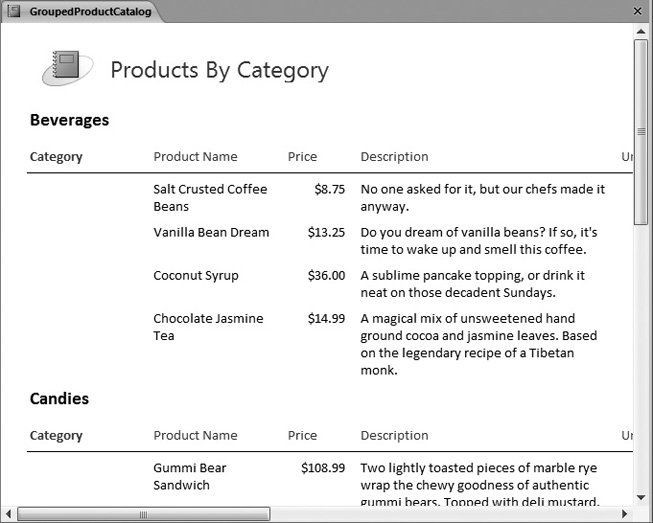
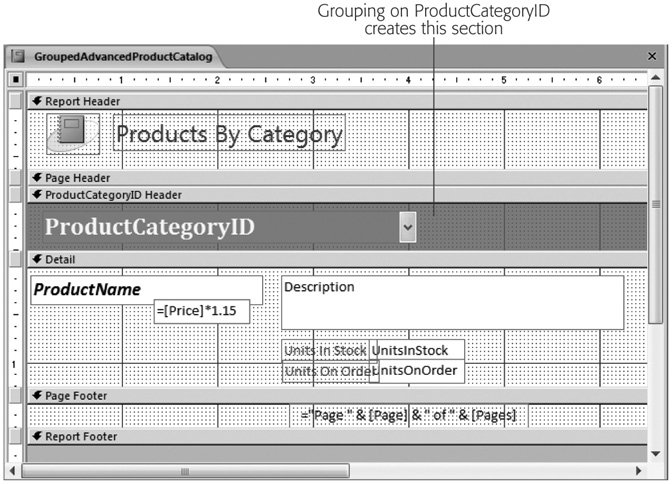
Grouping works by adding more sections to your report. If you group using the ProductCategoryID field, then your report gains a new section named Product-CategoryID Header, which Access places just above the detail section (see Figure 11-20). This group header includes information about the groupingin this case, the product category. The detail section has the data for each record that's placed in the group. Note: As you'll see later, you can actually add multiple levels of grouping. When you do, Access adds one group header for each level. 11.6.2. Fine-Tuning with the "Group, Sort, and Total" PaneOnce you have your grouping in place, you have many more options:
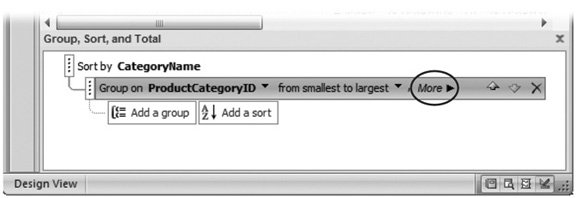
You can most easily add any of these features with the "Group, Sort, and Total" pane. To show it in Design view, choose Report Design Tools Design The Group, Sort, and Total pane appears at the bottom of the window. Figure 11-21 shows what you'll see if you examine the products-by-category report from Figure 11-19.
The following sections describe your options in the Group, Sort, and Total pane: 11.6.2.1. Sort byChooses the field that's used for sorting. In Figure 11-21, fields are sorted by CategoryName, and then grouped by ProductCategoryID.
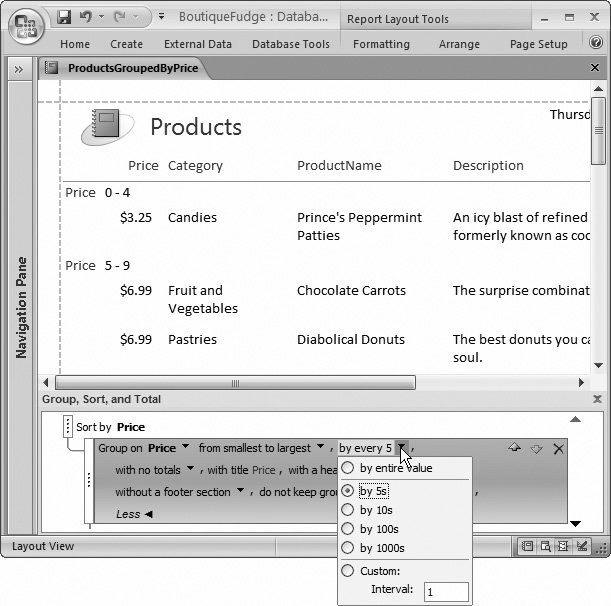
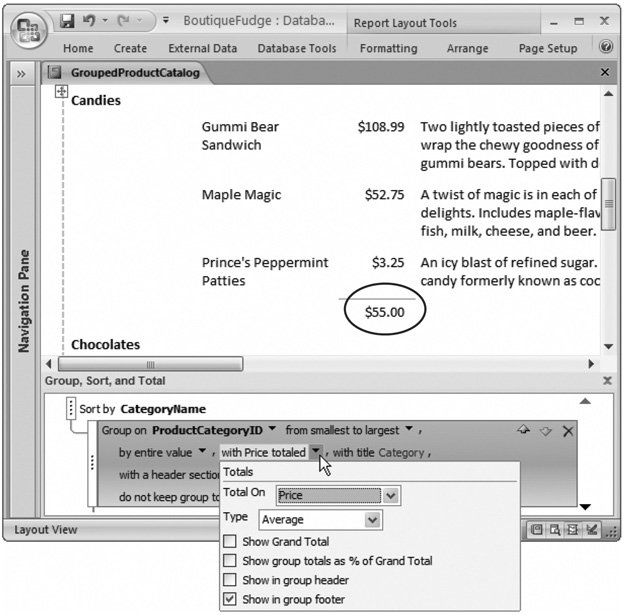
11.6.2.2. Group onChooses the field that's used for grouping. This option lets you switch up your grouping in a flash. 11.6.2.3. From A to Z/from smallest to largestChanges the sort order. The exact wording depends on the data type, but you can sort alphabetically for text, numerically for numbers , or chronologically for dates. 11.6.2.4. By entire valueTells Access to create a separate group for every different value in the grouped field. If you're grouping by ProductCategoryID, then this option ensures that Access places each category in a distinct group. In some situations, this approach creates too many groups, making it difficult to perform any analysis (and wasting reams of paper). In cases like that, you need a way to create larger groups that include more records. If you're grouping products by price or orders by date, then you may prefer to group a range of values, as shown in Figure 11-23. 11.6.2.5. With totaledSubtotals is the most popular grouping feature. Subtotals lets you compare how different groups stack up to one another. The "Group, Sort, and Total" pane lets you perform calculations using any numeric fields for your subtotals (Figure 11-24). Depending on what you're trying to accomplish, you can count values, add them, calculate averages, or determine maximum and minimum values in a group. You can place this information into a header that appears at the beginning of each group, or a footer that follows at the end. Finally, you can top your report off with a final grand total that adds up all the subgroups.
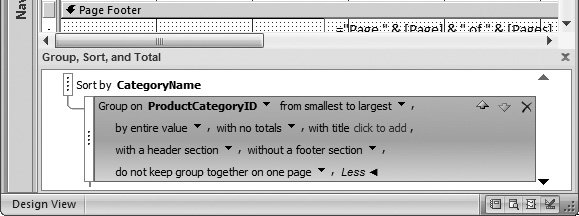
11.6.2.6. With titleClick this section to add a fixed title that appears in the category header, at the beginning of each category section. Of course, you can add a title on your own by inserting a label in Design view, but this option provides a convenient shortcut. 11.6.2.7. With a header section / with a footer sectionYou can apply a header at the beginning of each group, and a footer at the end. Once you add these sections, you can place any content you want in them using Design view. You'll use them most often to display information about the entire group, show subtotals, or draw separating lines with the line control (Section 11.1.4). 11.6.2.8. Keep group together on one pageThis setting helps you prevent orphaned category headers. In the product catalog example, this option makes sure you don't wind up with a group title like Beverages at the bottom of a page, and all the matching products on the following page. Ordinarily, Access doesn't prevent awkward page breaks. Instead, it simply tries to fill each page. If this isn't what you want, then you have two other choices. You can choose to make sure the entire group's always placed on the same page ( assuming it's less than one page long), or you can choose to make sure the header and at least one record are kept together on the same page.
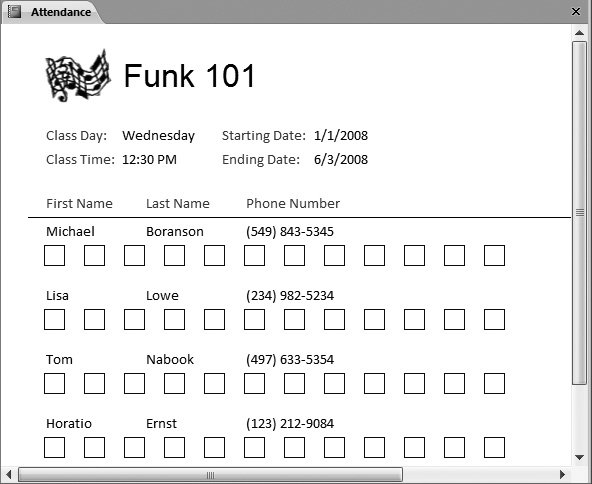
One option the "Group, Sort, and Total" pane doesn't offer you is forcing a new page break at the beginning of each group. To accomplish this, you need to switch to Design view, select the group header section, and then, in the Format section Property Sheet, look for the Force New Page setting (Section 11.5). Set it to Before Section to force a page break at the beginning of each new section, or After Section to force the page break at the end of the section. (You don't see a difference between these two settings unless you're using a report header and footer. If you have a report header and you use Before Section, then you end up with a page break between the report header and the first section.) Note: You don't see Force New Page setting's effect in Layout view, Report view, or Design view. It appears only when you use the Print Preview feature (Section 10.2), or when you actually print your report. In many scenarios, you'll want a group to start on a new page. This stipulation makes sense when printing the class list shown in Figure 11-25. In this case, the Force New Page setting lets you avoid putting two attendance lists on the same page.
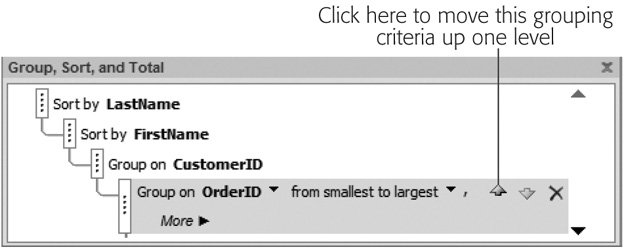
11.6.3. Multiple GroupsYour reports aren't limited to a single group. In fact, you can add as many levels of sorting and grouping as you want, to slice and dice your data into smaller, more tightly focused subgroups. To add another level of grouping, just right-click the field you want to use, and then click Group On. This adds it to the list in the "Group, Sort, and Total" pane. (You can also add additional levels of sorting by right-clicking a field, and then choosing a sort command. If you began by sorting and grouping your products into categories, then you could sort each category by product name.) When you have more than one group in the "Group, Sort, and Total" pane, it's important to make sure they're applied in the right order. If you try to group a list of ordered items by customer and then by product category, you'll get a different result from the one you get if you group first by category and then by customer. Figure 11-26 illustrates the issue. Each group you add can have a header and footer section and its own set of totals. You add these ingredients using the "Group, Sort, and Total" panejust select the appropriate grouping level, click More, and then change the various options, as described in the previous section.
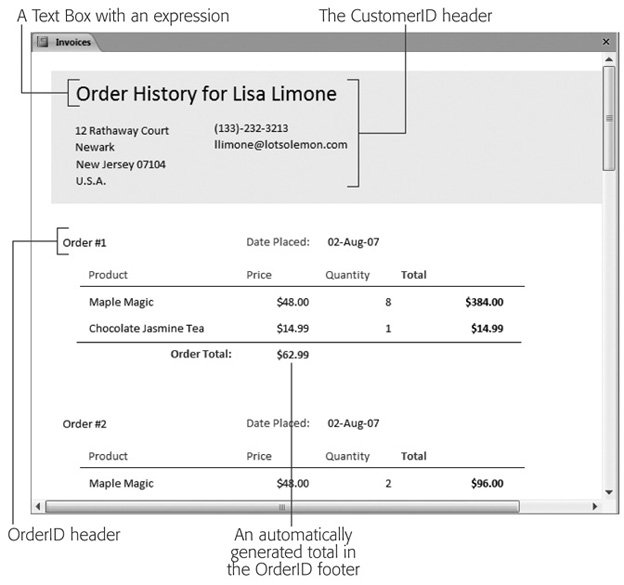
When you have more than one level of grouping, you can hide some of your information so you see just the totals. In Layout view, just choose Report Layout Tools Formatting Tip: The invoice example creates a report that prints invoices for all the orders in your database. However, you can use filtering (Section 3.2.2) to filter down the results to a specific order or customer. |
 Grouping & Totals