Recipe: Administrator/End-User Recipe: Project Summary The Project Summary page serves three main purposes. First, as the name indicates, it provides a concise overview of all the various projects. For each project, both the estimated and actual hours logged are shown in addition to the name of the project's manager. Second, this page serves as a gateway to the detail page, where the hours are broken down by employee. Finally, links under each project heading connect to the appropriate Add Time Card page so that new hours can be logged. Step 1: Implement Project Summary Design Meeting all the needs for this particular page calls for a compact layout. The summarized information is best displayed in a two-column table along with the associated links; the links should be visually separated from the data. The entire table structure will later be enclosed in a Repeat Region server behavior so that multiple projects can be summarized. 1. | In the server model of your choice, create a dynamic page.
 In the TimeCards folder, locate the folder for your server model and open the report_projectsummary page from there. In the TimeCards folder, locate the folder for your server model and open the report_projectsummary page from there.
| 2. | Add a table to the content region of your page to contain the form elements for the application.
From the Snippets panel, drag the Recipes > TimeCards > Wireframes > Project Summary Report - Wireframe snippet into the Content editable region.
| 3. | Add a table structure to allow for separation between repeating rows.
From the Snippets panel, drag the Recipes > TimeCards > ContentTables > Project Summary Report - Shell snippet into the row beneath the words PROJECT SUMMARY REPORT.
| 4. | Insert a two-column table with the first column right-justified for labels (for Project Name, Project Manager, Hours Budget, and Hours Used) and the second column left-justified to hold the dynamic text. The header area should include text for the two needed links: View Breakdown and Log Hours.
Place your cursor in the cell in the right side of the middle row of the justadded snippet and insert the Recipes > TimeCards > ContentTables > Project Summary Report - Content Table snippet.
| 5. | Save the file [r5-3].
r5-3. 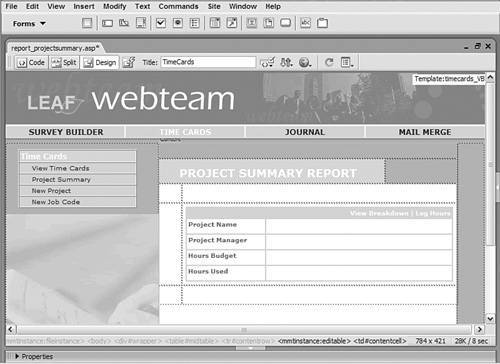
|
Step 2: Add Database Components Setting up the page logic for this recipe is very straightforward. Because all of the calculations are handled by the HoursBreakdown query and are presented by the ProjectSummary view, a simple recordset is all that's required for ASP and ColdFusion users. PHP developers will need to add custom code to simulate the queries and views. 1. | From the Bindings panel, choose Add (+) and select Recordset (Query).
| 2. | In the simple view of the Recordset dialog, enter an appropriate name.
Enter ProjectSummary in the Name field.
| 3. | Select the data source connection.
Choose Recipes from the Connection (Data Source) list.
| 4. | Choose the needed table.
From the Tables list, select ProjectSummary (projectsummary for PHP).
| 5. | Leave the Columns option set to All.
| 6. | Make sure the Filter is set to None.
| 7. | Keep the Sort option set to None and click OK to close the dialog.
| 8. | Save the page after the recordset is inserted.
|
For PHP As previously noted, PHP coders must include some custom code. 1. | In Code view, position your cursor near the top of the page after the code that begins <?php require_once and insert the following code:
From the Snippets panel, insert the Recipes > TimeCards > CustomCode_PHP > Project Summary - Simulate Querys and View snippet.

| [View full width] <?php // ProjectTimeCards Temporary Table mysql_select_db($database_Recipes, $Recipes); $sql = "DELETE FROM projecttimecards"; @mysql_query($sql,$Recipes); $sql = "INSERT INTO projecttimecards SELECT  projects.*, timecard.*,jobtypes.JobCode FROM projects, jobtypes LEFT JOIN timecard ON projects .ProjectID=timecard.CardProject GROUP BY ProjectID ORDER BY ProjectID"; @mysql_query($sql,$Recipes); $sql = "INSERT INTO projectsummary SELECT 0 AS ProjectHoursUsed, 0 AS ProjectDue , ProjectHours, ProjectManager, ProjectName, ProjectID FROM projects LEFT JOIN timecard on projects.projectID = timecard.CardProject WHERE CardID is Null"; @mysql_query($sql,$Recipes); // Hours Breakdown Temporary Table $sql = "DELETE FROM hoursbreakdown"; @mysql_query($sql,$Recipes); $sql = "INSERT INTO hoursbreakdown SELECT projecttimecards.ProjectID, projecttimecards .ProjectName, project timecards.ProjectManager, projecttimecards.ProjectHours, jobtypes .JobRate*projecttimecards.CardHours AS BillableAmount, ROUND((TO_DAYS(projecttimecards .ProjectDate) - TO_DAYS (projecttimecards .CardDate))/7) AS WeeksIn, projecttimecards.CardID, projecttimecards.CardDate, projecttimecards .CardDescription, projecttimecards.CardEmployee, projecttimecards.CardLogged, projecttimecards .CardJobTypeID, jobtypes.JobCode, SUM (timecard .CardHours) AS TotalHoursIn, projecttimecards .CardHours, projecttimecards.CardHours AS HoursIn, projecttimecards.CardProject, CONCAT('$',FORMAT (jobtypes.JobRate,2)) AS JobRate FROM project timecards,jobtypes,timecard WHERE (projecttimecards.CardJobTypeID = jobtypes .JobTypeID AND timecard.CardProject = projecttimecards.ProjectID) OR (projecttimecards.CardJobTypeID = 0) GROUP BY projecttimecards.ProjectID ORDER BY projecttimecards.CardID DESC"; @mysql_query($sql,$Recipes); // Create the ProjectSummary $sql = "DELETE FROM projectsummary"; @mysql_query($sql,$Recipes); $sql = "INSERT INTO projectsummary SELECT Sum (HoursBreakdown.CardHours) AS ProjectHoursUsed, Sum (HoursBreakdown.BillableAmount) AS ProjectDue, HoursBreakdown.ProjectHours, HoursBreakdown .ProjectManager, HoursBreakdown.ProjectName, HoursBreakdown.ProjectID FROM HoursBreakdown GROUP BY HoursBreakdown.ProjectHours, HoursBreakdown .ProjectManager, HoursBreakdown.ProjectName, HoursBreakdown.ProjectID ORDER BY HoursBreakdown .ProjectID"; @mysql_query($sql,$Recipes); ?> projects.*, timecard.*,jobtypes.JobCode FROM projects, jobtypes LEFT JOIN timecard ON projects .ProjectID=timecard.CardProject GROUP BY ProjectID ORDER BY ProjectID"; @mysql_query($sql,$Recipes); $sql = "INSERT INTO projectsummary SELECT 0 AS ProjectHoursUsed, 0 AS ProjectDue , ProjectHours, ProjectManager, ProjectName, ProjectID FROM projects LEFT JOIN timecard on projects.projectID = timecard.CardProject WHERE CardID is Null"; @mysql_query($sql,$Recipes); // Hours Breakdown Temporary Table $sql = "DELETE FROM hoursbreakdown"; @mysql_query($sql,$Recipes); $sql = "INSERT INTO hoursbreakdown SELECT projecttimecards.ProjectID, projecttimecards .ProjectName, project timecards.ProjectManager, projecttimecards.ProjectHours, jobtypes .JobRate*projecttimecards.CardHours AS BillableAmount, ROUND((TO_DAYS(projecttimecards .ProjectDate) - TO_DAYS (projecttimecards .CardDate))/7) AS WeeksIn, projecttimecards.CardID, projecttimecards.CardDate, projecttimecards .CardDescription, projecttimecards.CardEmployee, projecttimecards.CardLogged, projecttimecards .CardJobTypeID, jobtypes.JobCode, SUM (timecard .CardHours) AS TotalHoursIn, projecttimecards .CardHours, projecttimecards.CardHours AS HoursIn, projecttimecards.CardProject, CONCAT('$',FORMAT (jobtypes.JobRate,2)) AS JobRate FROM project timecards,jobtypes,timecard WHERE (projecttimecards.CardJobTypeID = jobtypes .JobTypeID AND timecard.CardProject = projecttimecards.ProjectID) OR (projecttimecards.CardJobTypeID = 0) GROUP BY projecttimecards.ProjectID ORDER BY projecttimecards.CardID DESC"; @mysql_query($sql,$Recipes); // Create the ProjectSummary $sql = "DELETE FROM projectsummary"; @mysql_query($sql,$Recipes); $sql = "INSERT INTO projectsummary SELECT Sum (HoursBreakdown.CardHours) AS ProjectHoursUsed, Sum (HoursBreakdown.BillableAmount) AS ProjectDue, HoursBreakdown.ProjectHours, HoursBreakdown .ProjectManager, HoursBreakdown.ProjectName, HoursBreakdown.ProjectID FROM HoursBreakdown GROUP BY HoursBreakdown.ProjectHours, HoursBreakdown .ProjectManager, HoursBreakdown.ProjectName, HoursBreakdown.ProjectID ORDER BY HoursBreakdown .ProjectID"; @mysql_query($sql,$Recipes); ?>
|
| 2. | Save the page.
|
Step 3: Data Binding Process In this step, we'll insert dynamic data from the recordset to display the summary information for each project. 1. | From the Bindings panel, expand the ProjectSummary recordset.
| 2. | Place the data fields on the page in their proper places.
| Drag ProjectName into the cell next to the Project Name label. | | | Drag ProjectManager into the cell next to the Project Manager label. | | | Drag ProjectHours into the cell next to the Hours Budget label. | | | Drag ProjectHoursUsed into the cell next to the Hours Used label [r5-4]. |
r5-4. 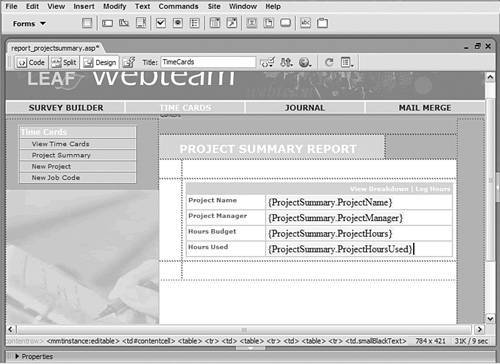
| 3. | When you're done, save the page.
|
Step 4: Make Dynamic Links After the dynamic data is inserted, we're ready to create the links mentioned earlier. The links to the detail and new time card pages each use the ProjectID field, returned in the recordset, to ensure that the proper project is referenced. First let's assemble the link to the detail page, View Breakdown. 1. | Select the text or image you want to link to the detail page.
Choose the phrase View Breakdown at the top of the content table.
| 2. | Click the folder icon next to the Link field in the Property inspector.
The Select File dialog opens.
| 3. | Make sure the dialog is set to Select File Name From File System.
| 4. | Choose Parameters at the bottom of the dialog.
| 5. | In the Name column of the Parameters dialog, enter the variable name.
Enter ID in the Name column.
| 6. | In the Value column, enter the dynamic value of the current project's ID.
Click the lightning bolt icon next in the Value column and, from the Dynamic Data dialog, choose ProjectID. When you're done, click OK once to close the Dynamic Data dialog, and again to close the Parameters dialog.
| 7. | In the Select File dialog, select the file that will be used to display the details of hours logged.
Choose report_hoursbreakdown in the TimeCards folder for your server model.
| 8. | When you're done, click OK to insert the link.
|
Next we'll create a link to log hours against a particular project. 1. | Select the text or image you want to link to the add_timecard file.
Choose the phrase Log Hours at the top of the content table.
| 2. | Click the folder icon next to the Link field in the Property inspector.
The Select File dialog opens.
| 3. | Make sure the dialog is set to Select File Name From File System.
| 4. | Choose Parameters at the bottom of the dialog.
| 5. | In the Name column of the Parameters dialog, enter the variable name.
Enter ID in the Name column.
| 6. | In the Value column, enter the dynamic value of the current project's ID.
Click the lightning bolt icon next in the Value column and, from the Dynamic Data dialog, choose ProjectID. When you're done, click OK once to close the Dynamic Data dialog, and again to close the Parameters dialog.
| 7. | In the Select File dialog, select the file that will be used to add new hours to a project.
Choose add_timecard in the TimeCards folder for your server model.
| 8. | When you're done, click OK to insert the link.
|
Step 5: Add Repeat Region Server Behavior To show summaries of all the available projects, we'll need to wrap our content table with a Repeat Region server behavior. Depending on how many projects you will be displaying, you could either show them all within the region or show a set number of them, like ten. If you choose the latter route, you'll also need to add recordset navigation controls. 1. | Select any of the dynamic data fields.
Note In ColdFusion, when applying any server behavior, like Repeat Region, to any tag that includes a color attributefor example, bgcolor="#FFCC00"you need to escape the # character by adding a second #. This is necessary because ColdFusion uses the # character to mark data fields and variables. If you encounter an error when testing this page, check your code and change any attributes within the <cfoutput> tags of the repeated region like bgcolor="#FFCC00" to bgcolor="##FFCC00". | 2. | From the Tag Selector, choose the appropriate table row tag that encompasses the entire table for the summary content.
Select the <tr> tag to the left of the <table> tag in the Tag Selector.
| 3. | From the Server Behaviors panel, choose Add (+) and select Repeat Region.
| 4. | In the Repeat Region dialog, choose the recordset.
Choose ProjectSummary from the Recordset list.
| 5. | Set the Show option to display however many records you'd like.
Choose Show All Records.
| 6. | Click OK when you're done and save your page.
|
After you have a few projects, enter Live Data view to see the summaries in Dreamweaver [r5-5]. r5-5. 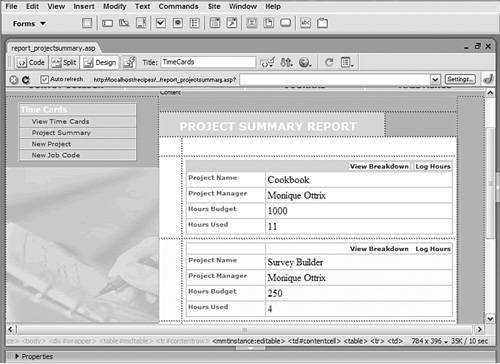
The code should look like: [View full width] <table width="80%" border="1" cellpadding="2" cellspacing="0" bordercolor="#FFCC00"> <tr > <td width="30%" bgcolor="#FFCC00"> </td> <td width="70%" align="right" bgcolor="#FFCC00"><a href="report_hoursbreak down .cfm?ID=#ProjectSummary.ProjectID#">View Breakdown</a> | <a href="add_timecard.cfm?ID=#ProjectSummary.ProjectID#">Log Hours</a></td> </tr> <tr> <td width="30%" align="left" valign="top" >Project Name </td> <td width="70%" >#ProjectSummary.ProjectName#</td> </tr> <tr> <td align="left" valign="top" >Project Manager </td> <td >#ProjectSummary.ProjectManager#</td> </tr> <tr> <td align="left" valign="top" >Hours Budget</td> <td >#ProjectSummary.ProjectHours#</td> </tr> <tr> <td align="left" valign="top" >Hours Used</td> <td >#ProjectSummary.ProjectHoursUsed#</td> </tr> </table>
|