Building Reports with Report Builder
| 1. | Select Table Report from the Report Layout menu on the right side. |
| 2. | Select Sales Territory from the entity explorer. |
| 3. | Under the Explorer pane, though still on the left side, is the list of fields and attributes. Select a name and drag it over to the layout view where it says "Drag and drop column fields." |
| 4. | After dragging the name over to the layout view, the entity explorer should have switched to entities that have a role relating to sales territory. From this list, select Sales Order Headers. |
| 5. | From the Attribute Fields menu, drag Order Year, which is located under Order Date, over next to the Sales Territory name. The mouse pointer should turn blue to signify that the table is ready to add a column. Note The Model Builder automatically creates expressions based on dates. These expressions are usually date parts . |
| 6. | Drag Order Quarter (also located under Order Date) over next to Order Year. |
| 7. | Drag Total Sub Total over next to Order Quarter. After doing this, notice three total lines that appeared. One of the nice features of Report Builder is that it automatically groups and sums data for you. |
| 8. | Enter Total Product Sales by Quarter by Territory in the text box above the table where it says "Click to add Title." |
Figure 16.13 should show you what your report should like.
Figure 16.13. View of a report in Report Builder.

The report can be previewed by clicking on the Run Report button from the toolbar.
Click-Through Reports
When the report is in Preview mode, the end user can hover over the Sum of Sales Totals number and notice that it is actually a link to another report. This type of report is called a click-through report and is automatically generated by Report Builder.
Click-through reports are based on roles. After a user has selected to display a certain type of aggregate attribute, if the attribute has roles linking over to another entity, Report Builder automatically generates a report listing the contents of that aggregate. You could potentially drill down to the lowest level, and at each stage Report Builder would generate a report based on that entity. This feature is called infinite drilldown . It is one of the benefits of putting work into generating models that contain information about all the relationships in the DBMS.
Saving/Publishing Reports
Now that you have completed this basic report, let's try to save it. Unlike in Visual Studio, the RDL file that has been generated by Report Builder cannot be saved on the user's hard drive. To save client-side reports, users must have access to publish reports in at least one folder on the Report Server. An easy way to enable this access is to enable the My Reports option on the Report Server.
This gives users permissions to their own My Report folder.
After enabling My Reports, saving a report is a simple matter. The menu options inside Report Builder are similar to the same commands in Microsoft Office. The only difference is that you are saving to the Report Server and not a file server. To save the existing report to the Report Server and call it "Sales by TerritoryTable," follow these steps:
| 1. | Click the File menu, and then click Save As. |
| 2. | In the root folder of the Report Server, enter the filename "Sales by TerritoryTable," and click OK. |
Matrix/Pivot Table Report
Now, let's continue on to make the same report using a pivot table or matrix. The concepts are the same; just the data region is different.
| 1. | If you have already closed Report Builder, reopen it. |
| 2. | Select the Matrix Report style from the Report Layout section on the right pane. |
| 3. | From the entity explorer, select Sales Territory, and drag the name attribute over to the matrix where it says "Drag and drop row groups." |
| 4. | From the entity explorer, select Sales Order Headers, and drag the Order Year under Order Date to the matrix layout where it says "Drag and drop column groups." |
| 5. | Similarly, select Order Quarter and drag it over to the matrix columns groups. Place it under Order Year. The mouse pointer should turn blue when it is ready to add a column group . |
| 6. | Select Sum Sub Total and drag it to the detail section of the matrix where it says "Drag and drop totals." |
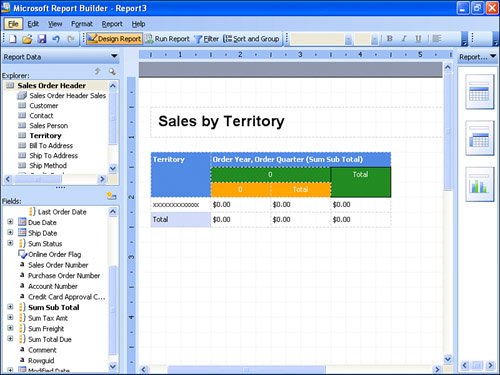
| 7. | Add a title to the report; call it Sales by Territory. |
| 8. | To make things easier to see, let's use some basic formatting to separate the quarters from the years . Right-click the inner 0, and select Format from the shortcut menu. |
| 9. | Go to the Fill tab and select Gold as the color . Then go to the Alignment tab and choose Center for the horizontal alignment. Do the same for the Adjoining Total text box. This should make all quarters- related information headers gold. |
| 10. | Do the same thing to the upper 0 and the adjoining total, except select Green as the color. Select Center for the horizontal alignment. On the Border tab, click the Outline button to put an outline border around the year. |
| 11. | Right -click the Sum Sub Total text box, select Format from the shortcut menu, go to the Number tab, and select the currency format. |
When everything is complete, your report design should look similar to Figure 16.14.
Figure 16.14. Finalized report design.
When the report is previewed, it looks similar to Figure 16.15.
Figure 16.15. Preview of the report in Report Designer.

Save this report on the Report Server as "Sales by TerritoryMatrix."
EAN: 2147483647
Pages: 254