Section 9.1. Setting a Breakpoint
9.1. Setting a BreakpointTo get started with the debugger, return to Example 8-1. You'll be putting a breakpoint on the first line of Main( ) to see how this code actually works. A breakpoint is an instruction to the debugger to stop running. You set a breakpoint, run the program, and the debugger runs the program up until the breakpoint. Then you have the opportunity to examine the value of your variables at this point in the execution. Examining your program as it runs can help you untangle otherwise impenetrable problems. It is common to set multiple breakpoints, which allows you to skip through your program, examining the state of your object at selected locations. You can set a breakpoint in many different ways. The easiest is to click in the far-left margin. This causes a red dot to appear in the margin next to the relevant line of code, which is also highlighted in red, as shown in Figure 9-1. Notice that as you hover over the breakpoint, it tells you the line on which the breakpoint appears. Figure 9-1. Setting a breakpoint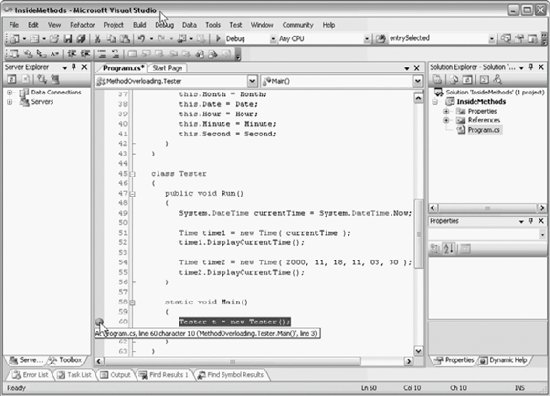 You are now ready to run the program to the breakpoint. To do so, you must be sure to run in debug mode, which you can do by clicking the Start button or by choosing the Start Debugging item from the Debug menu. In any case, the program starts and runs to the breakpoint, as shown in Figure 9-2. The program stops just before executing the statement with the breakpoint, and that statement is highlighted. There are a number of helpful windows open as well, which we'll examine in a moment. The most useful feature of the debugger is the ability to step into the code, or execute the program one line at a time, watching the changes that happen with each line. To step into the code, press the F11 function key twice. With the first keypress , the Tester object is created. The second keypress moves you to the next line in the code, which calls the Run( ) method. Press the key once more to step inside the code for the Run( ) method where the program assigns the value of System.DateTime.Now to the currentTime variable. Figure 9-2. At the breakpoint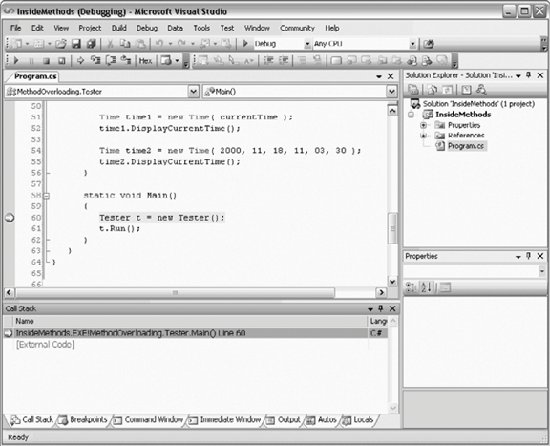
9.1.1. Using the Debug Menu to Set Your BreakpointInstead of clicking in the margin to set your breakpoint, you can use the New Breakpoint item on the Debug menu (or use the keyboard shortcut for the menu item, Ctrl-D, N). This brings up the New Breakpoint dialog box , as shown in Figure 9-3. In this dialog box, you can specify the name of the method where you want to break, and even the line and character within the method, if you know it. Figure 9-3. The New Breakpoint dialog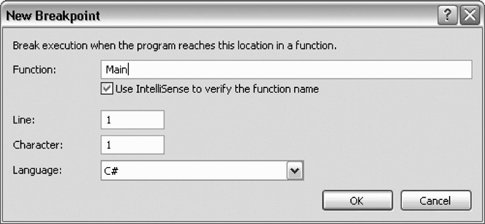 You can also examine and manipulate all the breakpoints together in the Breakpoints window, as shown in Figure 9-4. Figure 9-4. Breakpoints window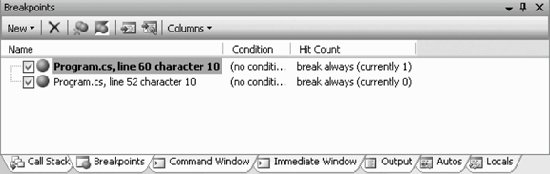 9.1.2. Setting Conditions and Hit CountsThe default behavior is for the breakpoint to cause the program to break every time you pass that line of code. Sometimes you only want to break (for example) every 20th time it passes that line of code, or only if the value of some variable is greater than, for example, 0. You can set conditions on the breakpoint by right clicking on it in the Editor window or in the Breakpoints window, as shown in Figure 9-5. Figure 9-5. Breakpoint menu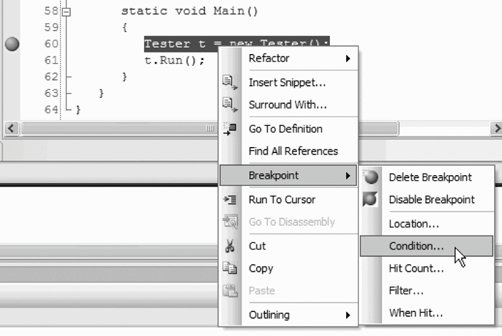 Choose either Hit Count or Condition. If you choose Hit Count, you are offered variations such as "when the hit count is a multiple of ... ," as shown in Figure 9-6. Figure 9-6. Breakpoint Hit Count dialog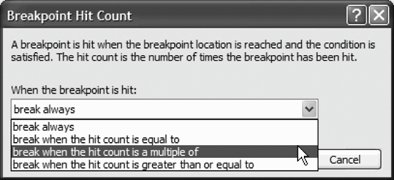 If you choose Condition, an open-ended condition text box is provided. In Figure 9-7, I have typed in the Value > 20 as an example. |

EAN: 2147483647
Pages: 250