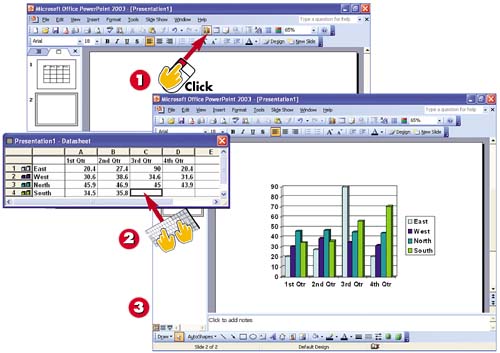
Click the Insert Chart button on the Standard toolbar to open a sample chart and Datasheet window.
Type the desired data in the datasheet, using the Tab and arrow keys to move between the cells, just like in Excel.
The chart automatically updates to reflect the data you type into the datasheet.
INTRODUCTION
Charts can be a great way to get your point across in a presentation because they present data visually. For example, instead of including a worksheet or table, you could use a graph that shows a comparison of your sales regions by quarter.
TIP
Adding an Excel Chart
To insert an existing Excel chart directly into your presentation, select Insert, Object. Then, select Microsoft Excel Chart from the Object Type list (make sure the Create New option is selected) and click OK.
TIP
Copying and Pasting
An alternative to typing all the information into your datasheet is to copy and paste it from your source (if you have a data source) such as Excel, for example.