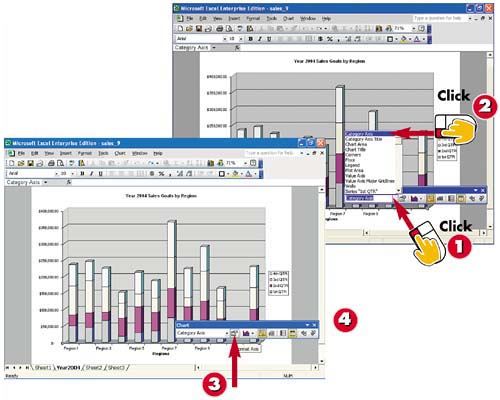
Click the Chart Objects down arrow and select the object in the chart you want to edit (scroll through the list if necessary).
After you select the object, for example, the Category Axis, you can use the other buttons on the Chart toolbar to make changes to it.
Move the mouse pointer over the rest of the buttons on the Chart toolbar to see ScreenTips of the other types of edits you can make to your chart.
Format the object, alter the chart type, add a legend and/or data table, swap the series data by row or by column, and change text objects' direction angle.
INTRODUCTION
Charts are useful for interpreting data, but different people look at data in different ways. To accommodate different users, you can change titles, legend information, axis points, category names, and more. The Chart toolbar which you can activate by opening the View menu and selecting Toolbars, Chart lists all the items in your chart that you can alter. Simply indicate which chart object you want to alter, and then click the appropriate button. If you don't know the name of the item you want to format on your chart, simply click the object on the chart and the name will appear in the Chart Objects list box on the Chart toolbar.
TIP
Double-Clicking the Chart
One of the fastest ways to edit a chart's options is to double-click the element in the chart you want to alter. The appropriate dialog box opens, enabling you to make the changes you need.