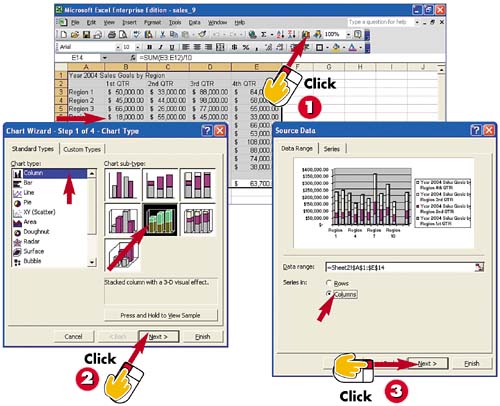
Select the cells you want to include in your chart, and click the Chart Wizard button on the Standard toolbar.
The first page of the Chart Wizard opens. Select a type from the Chart Type list and the Chart Sub-type list; then click Next.
Depending on how you want your information to display in the chart, select either Rows or Columns in the Series in area; then click Next.
INTRODUCTION
Interpreting numeric data by looking at numbers in a table can be difficult. Using data to create charts can help people visualize the data's significance. For example, you might not have noticed in a spreadsheet that the same month of every year has low sales figures, but it becomes obvious when you make a chart from the data in that spreadsheet. The chart's visual nature also helps others review your data without the need to review every single number.
TIP
Viewing a Sample
The Chart Wizard enables you to select how your data looks with a chart type and subtype. To do so, move your mouse pointer over the Press and Hold to View Sample button and then press and hold down the left mouse button.
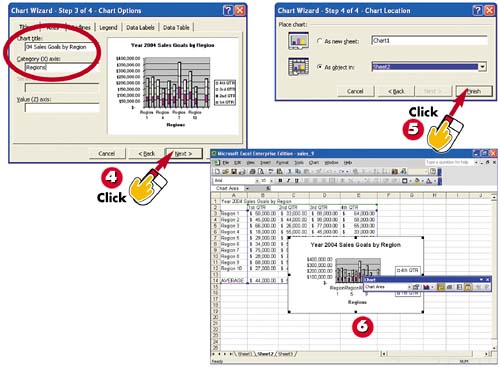
Type a Chart title, a value for the Category (X) axis, and any other values you want; then click Next.
Click the As New Sheet option button to enter the chart as a new sheet, or click the As Object in option button to enter the chart in the sheet you select. Click Finish.
Excel creates the chart, displaying it along with a Chart toolbar.
TIP
Moving a Chart
Regardless of your selection in step 8, you can always move your chart to another (perhaps new) worksheet. To move your chart to a new worksheet, simply right-click a blank area in the chart and select Location from the shortcut menu that appears. Click the As New Sheet option in the Chart Location dialog box, and type in a new worksheet name. If you want to move it to a different worksheet, click the As Object in option and select the worksheet name from the drop-down list. Click OK, and Excel places the chart on a new worksheet.
TIP
Using the Back and Cancel Buttons
At any time while using the Chart Wizard, you can click the Back button to return to previous screens or the Cancel button to start over. Click the Finish button at any time and add information to your chart afterward.