Debugging
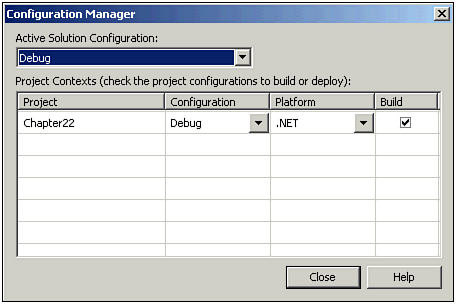
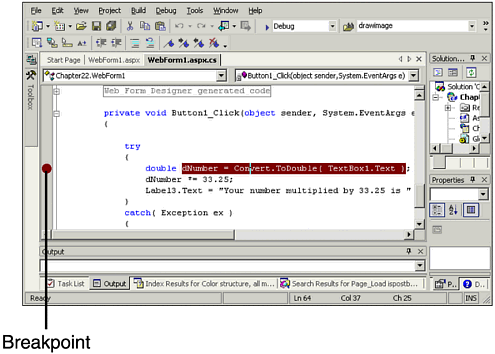
| Using the ASP.NET debugger might be the most effective way to track down and identify problems. Because ASP.NET is compiled into assemblies, it is possible to debug them pretty much the same way that you are used to debugging VB and C++ applications. But before you can use the debugger you must make sure that the application has been compiled with debug symbols included. This enables you to do the source-level debugging. To ensure that you are set to include the debug symbols in your assembly, open up the Configuration Manager dialog box and be sure Debug is selected in the Active Solution Configuration drop-down box, as shown in Figure 22.3. Figure 22.3. You must set the compiler to include source-level debug symbols. After your application has been compiled with the debug symbols, you can debug your application in a number of ways. The way I find most useful is to set a break point somewhere in the code and then let the application run until it gets to that break point, at which time it stops execution and waits for other instructions. To set a break point in your code, all you need to do is open up the source code module in which you want to set the break point, position the cursor over the line where you want the code execution to break, and then press the F9 key. A red circle appears to the left of the line of code where the break point has been set, as shown in Figure 22.4 (you can't see red in the figure, but you can see the circle). Figure 22.4. Setting breakpoints is easy, and it gives you the most effective way to find problems. To help you manage your break points, you can find three menu items under the Debug menu. The first enables you to set a new break point, the second enables you to clear all break points, and the third enables to disable all break points. These three menu items can make your job of setting, using, and maintaining break points a lot easier. In the next few sections we're going to talk about effective use of the Visual Studio .NET IDE for debugging. We'll cover
Stepping Through Code with the DebuggerWhen your code stops executing, it waits for further instruction. You may decide that you want to execute a few more lines of code before you actually take a serious look at the variables and your data. To step from one line of code to the next, use the Step Over command, which can be easily performed with the F10 key (which is the default key assignment). There might also be instances where you want to step in to other methods. Using the F10 key enables you to actually step over other methods and not step into them. If that's not what you want, use the Step Into command, which can easily be performed with the F11 key (which is the default key assignment), to step into methods and view the code that is contained within them. If, at any time, you want to continue with the execution, you can use the Start command, which is performed with the F5 key (which is the default key assignment), and this enables execution for your application to continue until the debugger encounters another break point. Table 22.2 sums up the navigation commands. Table 22.2. The Debugger's Most Frequently Used Commands
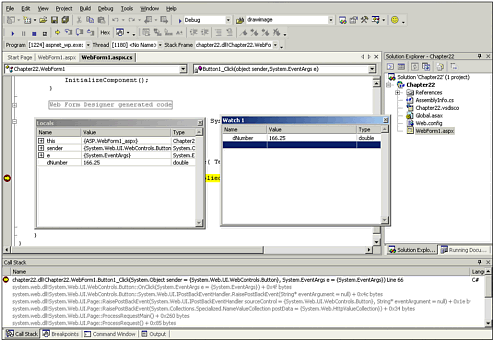
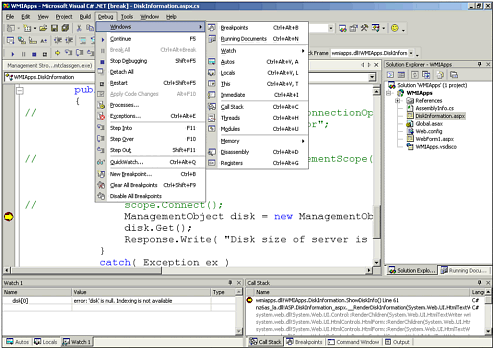
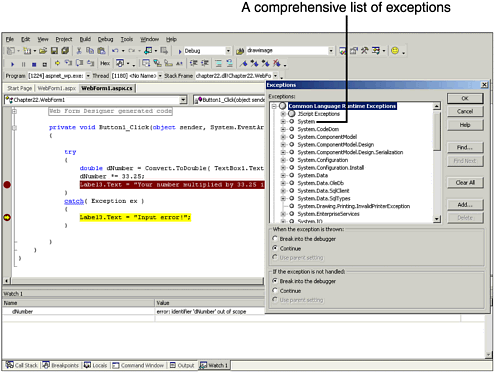
Variables in WindowsThere are several ways to examine variables. The easiest is in the Locals and Watch windows. The Locals window contains all local variables, and displays their contents as you step through the source code. The Watch window displays any variables that you desire to examine, whether local or global. Both of these windows, along with the Call Stack window, can be seen in Figure 22.5. Figure 22.5. Here you can see the Locals, Watch, and Call Stack windows. The Call Stack window tells you which code called the code that you're currently viewing. The Call Stack window even shows you the point of origin if the calling process was code in the CLR. Debug WindowsYou might find quite a few additional debug windows useful. They can all be opened from the Windows menu item in the Debug menu as shown in Figure 22.6. Figure 22.6. The Debug menu can show you many debug windows. When I first took at look at Visual Studio .NET, I expected to see the IL disassembly in the debug disassembly window. This would have been useful in a number of situations where knowing the IL code could shed more light on the inner workings of the code. But the disassembler shows x86 instructions, not Microsoft Intermedia Language (MSIL). This is a real disappointment. ExceptionsThe Exceptions debug window is especially helpful. When an exception is thrown, it shows you useful information such as the message and the origin. You can display a long list of exceptions, as shown in Figure 22.7. Figure 22.7. Here you can see an exception that was caught, the details in the Exceptions window, and the Exceptions dialog. |
EAN: 2147483647
Pages: 233