 | Team-Fly  | |
 | DB2 Universal Database for OS/390 v7.1 Application Certification Guide
By Susan Lawson
| | Table of Contents | | | | Chapter 17. Application Performance and Optimization |
Database Monitoring Database monitoring should be an ongoing proactive process. There are a variety of ways to monitor DB2 such as traces and specialized monitoring software. DB2 PM IBM's DB2 PM (DB2 Performance Monitor) is a performance analysis tool for both the subsystem and applications. Its primary objective is to report DB2 instrumentation data in a form that is easy to understand and analyze. DB2 PM presents this instrumentation data in the following ways: -
The Batch reports present the data you select in comprehensive reports or graphs containing systemwide and application- related information for both single DB2 subsystems and DB2 members of a data sharing group . You can combine instrumentation data from several different DB2 locations into one report. Batch reports can be used to examine performance problems and trends over a period of time. -
The Online Monitor gives a current "snapshot" view of a running DB2 subsystem, including applications that are running. Its history function displays information about subsystem and application activity in the recent past. -
The Statistics reports provide an excellent source of information, such as buffer pools, EDM pools, RID processing, and logging, all at a subsystem level. -
The Accounting reports provide information about applications for specific time periods. Those are the most popular, most useful reports for ongoing analysis, trend analysis, and predictive monitoring. There are also some more specific reports, such as the Lock Detail Analysis report for monitoring locking problems. The more detailed reports require additional traces to be turned on and should be used only for problem analysis and not run on a continual basis. Both Accounting and Statistics reports have long and short versions. Which is used depends on the amount of detail needed for analysis. DB2 PM also includes User -Tailored Reports (UTRs) that allow you to tailor reports for more precise analysis. The online portion of the DB2 PM product has a very user-friendly GUI. Figure 17-1 shows the main screen of the DB2 PM GUI. It has a look and feel similar to the DB2 Control Center. From here you can monitor all of your DB2 subsystems and your data-sharing environment. Figure 17-2 gives you a look at a detail screen. Figure 17-1. DB2 PM GUI main screen.  Figure 17-2. DB2 PM GUI locking detail screen. 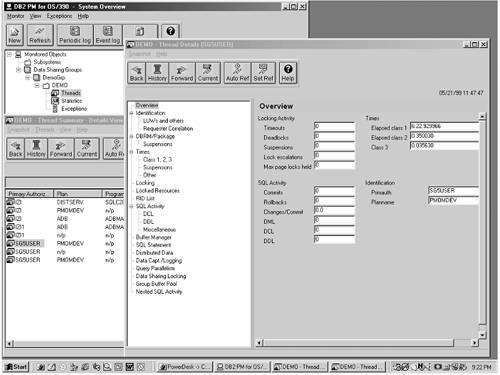 Resource Limit Facility DB2's resource limit facility ( governor ) lets you perform the following activities: -
Set warning and error thresholds by which the governor can inform users (via your application programs) that a certain processing limit might be exceeded for a particular dynamic SELECT, INSERT, UPDATE, or DELETE statement. This is called predictive governin g. -
Stop a currently executing dynamic SQL statement (SELECT, INSERT, UPDATE, or DELETE) that exceeds the processor limit that you have specified for that statement. This is sometimes called reactive governin g to differentiate its function from that of predictive governing , a function that is also handled by the resource limit facility. The resource limit facility does not control static SQL statements, whether or not they are executed locally or remotely. -
Restrict bind and rebind activities to avoid performance impacts on production data. -
Restrict particular parallelism modes for dynamic queries. |