Your First Report
You are now ready to build your first Reporting Services report. Of course, few people build reports just for the fun of it. Usually there is some business reason for this endeavor. In this book, as stated in the previous chapter, we use the business needs of Galactic Delivery Services (GDS) as the basis for our sample reports.
Each of the sample reports used in this book is presented in a manner similar to what you see in this section. The report is introduced with a list of the Reporting Services features it highlights. This is followed by the business need of our sample company, Galactic Delivery Services, which this report is meant to fill. Next is an overview of the tasks that must be accomplished to create the report.
Finally, there are the steps to walk through for each task, step by step. In addition to the step-by-step description, each task includes a few notes to provide additional information on the steps you just completed. Follow the step-by-step instructions to complete the task, and then read through the task notes to gain additional understanding of the process you have just completed. You can complete the step-by-step instructions using either the Business Intelligence Development Studio or Visual Studio 2005.
The Customer List Report
Here is our first attempt at creating a report: the Customer List Report.
Features Highlighted
-
Creating a data source
-
Using the Query Designer to create a dataset
-
Using the Report Wizard to create a table report
Business Need The accounting department at Galactic Delivery Services would like an e-mail directory containing all the billing contacts for its customers. The directory should be an alphabetical list of all GDS customers. It must include the customer name, along with a billing contact and a billing e-mail address for each customer.
Task Overview
-
Begin a New Project in the Business Intelligence Development Studio or Visual Studio
-
Create a Data Source
-
Create a Dataset
-
Choose the Report Layout
Customer List Report, Task 1: Begin a New Project in the Business Intelligence Development Studio or Visual Studio
-
Run the Business Intelligence Development Studio or Visual Studio 2005. The Start page appears as shown here.
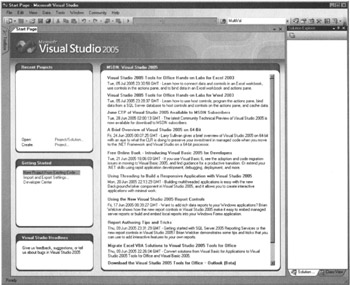
Note The first illustration shows the default configuration of The Business Intelligence Development Studio. Your screen may vary if this configuration has been changed.
-
Click the New Project toolbar button to create a new project. This displays the New Project dialog box, as shown in the following illustration. (You can create a new project in three different ways: Select File|New|Project from the Main menu, click the New Project toolbar button, or click the Create: Project link on the Start page.)
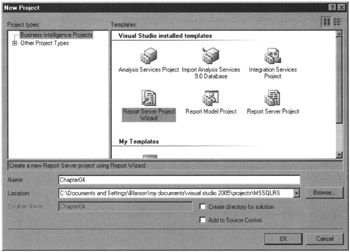
-
Select Business Intelligence Projects in the Project Types area of the dialog box.
-
Select Report Server Project Wizard in the Templates area of the dialog box.
-
Type Chapter04 for the project name. This project will contain all the reports you create in this chapter.
-
Click Browse to open the Project Location dialog box.
-
Click My Projects to go to the Visual Studio Projects folder.
-
Click the Create New Folder button in the toolbar at the top of the Project Location dialog box. If you have trouble finding the Create New Folder button, look along the top of the dialog box for a picture of a folder with a yellow sparkle.
-
Enter MSSQLRS for the name of the new folder. This folder will contain all the projects you create for this book.
-
Click OK in the New Folder dialog box.
-
Click Open in the lower-right corner of the Project Location dialog box. The New Project dialog box should now look like the second illustration.
Task Notes We have now established a name and location for this project. This must be done for every project you create. Because the Business Intelligence Development Studio and Visual Studio 2005 use the project name to create a folder for all the project files, the project name must be a valid Windows folder name. You can use the Browse button to browse to the appropriate location, as we did here, or you can type the path in the Location text box.
| Note | Valid folder names can contain any character, except the following:
In addition, a folder cannot be named "." or"..". |
The project name is appended to the end of the location path to create the full path for the folder that will contain the new project. In our example, a folder called Chapter04 will be created inside the folder MSSQLRS. All the files created as part of the Chapter04 project will be placed in this folder.
Customer List Report, Task 2: Create a Data Source
-
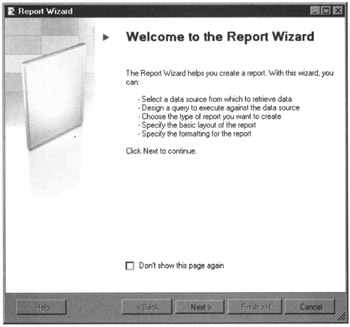
Click OK in the New Project dialog box to start the Report Wizard. The Welcome to the Report Wizard page appears as shown here.
-
Click Next. The Select the Data Source page appears.
-
Type Galactic for the data source name.
-
Select Microsoft SQL Server from the Type drop-down list, if it is not already selected.
-
Click Edit. The Connection Properties dialog box appears.
-
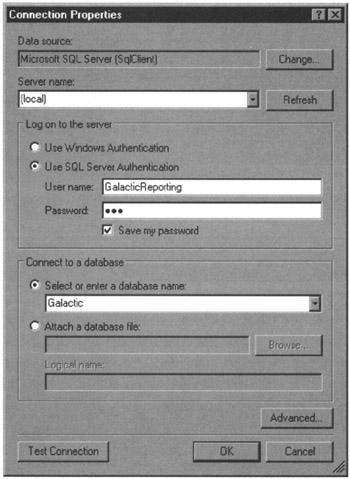
Type the name of the Microsoft SQL Server database server that is hosting the Galactic database. If the Galactic database is hosted by the computer you are currently working on, you may type (local) for the server name.
-
Click the Use SQL Server Authentication radio button.
-
Type GalacticReporting for the user name.
-
Type gds for the Password.
-
Click the Save My Password check box.
-
Select Galactic from the Select or Enter a Database Name drop-down list. The Connection Properties dialog box should now look like this:
-
Click the Test Connection button. If the message “Test connection succeeded” appears, click OK. If an error message appears, make sure the name of your database server, the user name, the password, and the name of your database were entered properly. If your test connection still does not succeed, make sure you have correctly installed the Galactic database.
-
Click OK to return to the Select the Data Source page of the Report Wizard.
-
Click the Make This a Shared Data Source check box so it is checked. This page should now look like this:
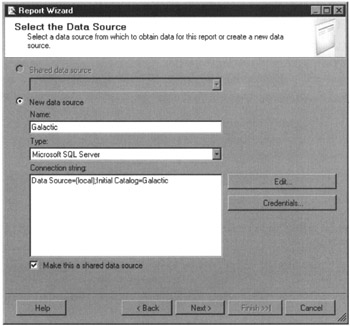
Task Notes As discussed in Chapter 1, the data source is a set of instructions for connecting to the database server or the data file that will provide the information for your report. This set of instructions is also known as a connection string. In this sample report, we used the Connection Properties dialog box to build the connection string. Those of you who memorize connection strings can type the appropriate string on the Select the Data Source page without using the Connection Properties dialog box at all. The rest of us will continue to use the Connection Properties dialog box when building future reports to have the connection string created for us.
| Caution | If you do type in your own connection string, do not include the login and password information. The connection string is stored as plain text in the report definition file, so a password stored as part of the connection string is easy to discover. Instead, use the Credentials button on the Select the Data Source page to enter the login and password, so they are stored in a more secure fashion. |
Reporting Services can utilize data from a number of different databases and data files, but you need to tell the wizard what type of database or data file the report will be using. You did this using the Type drop-down list in Step 4 of the previous task. This selection tells Reporting Services which data provider to use when accessing the database or data file. When you select Microsoft SQL Server, Reporting Services uses the .NET Framework Data Provider for SQL Server. This data provider knows how to retrieve information from a SQL Server database.
The Type drop-down list on the Select the Data Source page includes only a few of the possible types of data sources. If you are using data from a data source other than a Microsoft SQL Server database, you need to click the Change button on the Connection Properties dialog box. This displays the Change Data Source dialog box shown in the following illustration.
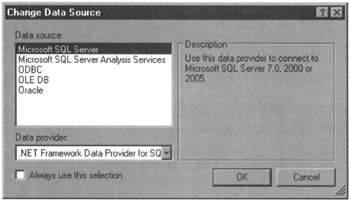
Use this dialog box to select the appropriate data source type.
Each data provider requires slightly different bits of information to create the connection string. The Connection Properties dialog box changes to suit the selected data provider. This means Steps 6 through 11 will vary when you use a data source type other than Microsoft SQL Server. Simply provide the information requested on the Connection Properties dialog box. Be sure to use Test Connection to make sure everything is entered properly before leaving the Connection Properties dialog box.
Checking the Save My Password check box on the Connection Properties page allows the data source credentials to be saved with the data source definition. The data source credentials are the user name and password information required to access that data source. The credentials are encrypted before they are saved to help protect them. If you are not comfortable having the credentials stored in this manner, leave both the user name and password blank. You will be prompted for the credentials every time you execute the report or modify the dataset.
| Note | If you leave the data source credentials blank and your selected data source requires a login, you will be prompted for database credentials when you click Next on the Select the Data Source page. The credentials you enter here are used to create a connection to the data source for the Design the Query page and for the Query Designer. These credentials are not stored with the data source. |
A data source can be used by a single report, or it can be shared by several reports in the same project. Checking the Make This a Shared Data Source check box allows this data source to be used by many reports. Shared data sources are stored separately from the reports that use them. Nonshared data sources are stored right in the report definition. If you have a number of reports in the same project that utilize data from the same database or the same data files, you will save time by using a shared data source.
| Caution | Even though the data source credentials are encrypted, it is never a good idea to use the system administrator account or any other database login with system administrator privileges to access data for reporting. Always create a database login that has only the privileges required for reporting operations and use this login as the reporting credentials. |
Some companies require that reports use data from a development database server while they are being developed and a production database server when the reports are completed. Using a shared data source in this type of an environment makes it easier to switch a number of reports from the development database server to the production database server. The change is made once to the shared data source, and all the reports are ready to go.
Customer List Report, Task 3: Create a Dataset
-
Click Next. The Design the Query page of the Report Wizard appears.
-
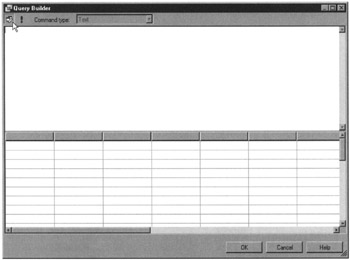
Click Query Builder. The Query Designer window appears with the Generic Query Designer active. Click the Query Designer toggle button as shown in the following illustration. The Query Designer will switch to the Graphical Query Designer.
-
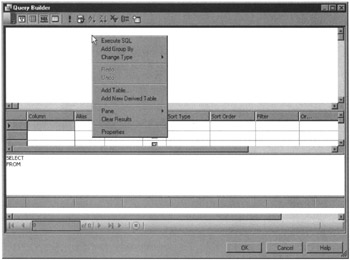
The Graphical Query Designer is divided into four horizontal sections. The top section is called the diagram pane. Right-click in the diagram pane. You see the Context menu as shown here.
-
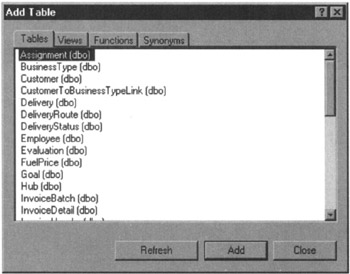
Select the Add Table command from the Context menu. This displays the Add Table dialog box shown here. This dialog box contains a list of all the tables, views, and functions that return datasets, which are found in the data source.
-
Double-click Customer (dbo) in the list of tables. The Customer table is added to the query.
-
Click Close to exit the Add Table dialog box.
-
A list of the fields in the Customer table is displayed. Click the check box next to the Name field.
-
Scroll down the list of fields and check the BillingContact and BillingEmail fields as well.
-
The section of the Query Designer directly below the diagram pane is called the critieria pane. In the critieria pane, type 1 in the Sort Order column across from the Name field. Or, you can click in the Sort Order column across from the Name field and select 1 from the drop-down list.
-
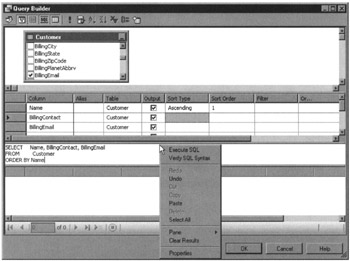
The section of the Query Designer directly below the criteria pane is the SQL pane. Right-click in the SQL pane. You see the Context menu shown here.
-
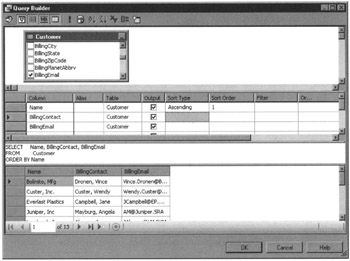
Select Execute SQL from the Context menu. This runs the query and displays the results in the bottom section of the Query Designer. This bottom section is called the results pane. The Query Designer should now look like this:
-
Right-click in the results pane. Select Clear Results from the Context menu.
-
Click OK to return to the Design the Query page of the Report Wizard. This page should now look like the following illustration.
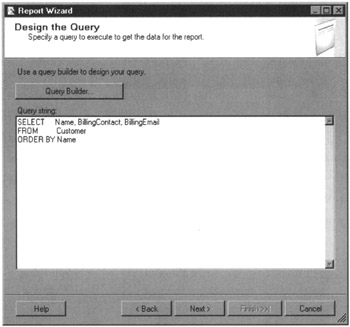
Task Notes The dataset represents the information to be retrieved from the data source and used in your report. The dataset consists of two parts. The first part is the database command used to retrieve data. This is the SELECT statement you created using the Query Designer. This database command is called the query string.
The second part is the list of the columns in the result set created by executing the query string. This list of columns is called the structure or schema of the result set. Visual Studio determines the field list by executing the query string in a special manner, so it returns the structure of the result set, but it does not return any rows in the result set.
Those of you familiar with your data source, and also familiar with the SELECT statement, can type your SELECT statement in the Query String text box on the Design the Query page. This is especially appropriate when you are executing a stored procedure to retrieve data, rather than using a SELECT statement. A stored procedure is a program saved inside the database itself that can be used to modify or retrieve data. Using stored procedures in a query string is discussed more in Chapter 7.
It is a good idea to run the query yourself before exiting the Query Designer. We did this in Steps 10 and 11 of this task. This ensures no errors exist in the SQL statement the Query Designer created for you. It also lets you look at the result set in the results pane, so you can make sure you are getting the information you expected.
To display the result set in the results pane, the Query Designer must first load the result set in memory. Keeping result sets in memory can take up valuable resources that might be needed by other programs. This memory is not automatically cleared when you exit the Query Designer. For this reason, you should always clear the result set yourself, as we did in Step 12 of this task. If you do not clear the result set yourself, eventually you will see a dialog box reminding you that the result set is open and asking whether you plan on making any further use of it. If this happens, click No to tell the Query Designer you no longer need the result set.
Customer List Report, Task 4: Choose the Report Layout
-
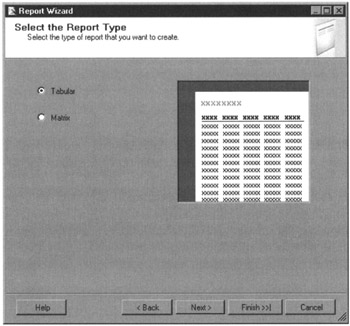
Click Next. The Select the Report Type page of the Report Wizard appears.
-
Make sure the Tabular radio button is selected and click Next. The Design the Table page of the Report Wizard appears.
-
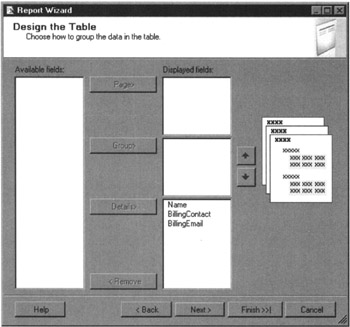
With the Name field highlighted in the Available Fields list, click Details. The Name field moves to the Displayed Fields list.
-
Do the same thing with the BillingContact and BillingEmail fields. The Design the Table page should now look like the following illustration.
-
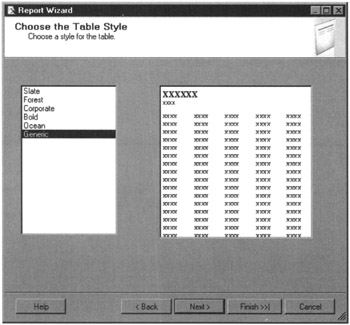
Click Next. The Choose the Table Style page of the Report Wizard appears as shown here.
-
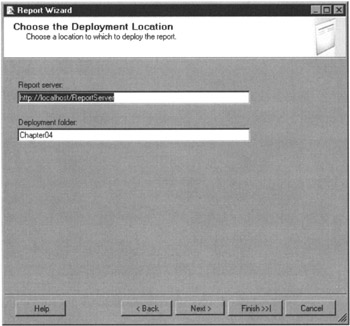
Select the Generic style in the style list and click Next. The Choose the Deployment Location page of the Report Wizard appears.
-
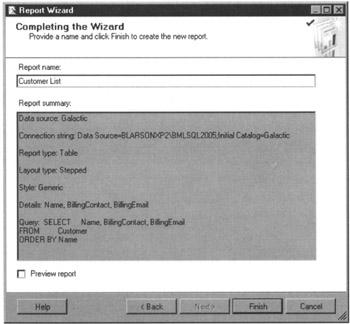
Click Next. The Completing the Wizard page appears.
-
Type Customer List for the report name.
-
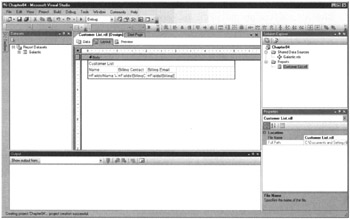
Click Finish. The Business Intelligence Development Studio or Visual Studio window appears with the Report Designer active.
-
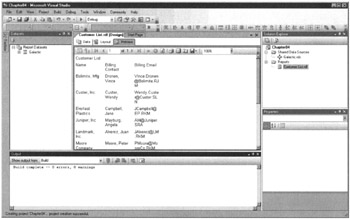
Click the Preview tab located near the middle of the screen just above the report layout. A preview of your report appears.
-
Click the Layout tab.
-
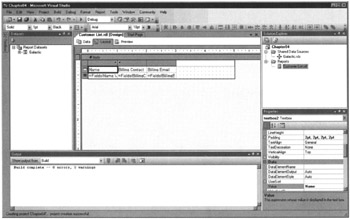
The Report Wizard created columns in our report that seem a bit too narrow. We can improve the report by widening the columns. Click the Name heading (“Name” in a cell by itself).
-
Place your mouse pointer on the line separating the gray box above the Name heading and the gray box above the Billing Contact heading. Your mouse pointer changes to a double-headed arrow, as shown here.
-
Hold down the left mouse button and move the mouse pointer to the right. This makes the Name column wider.
-
Follow the technique described in Step 14 of this task to widen the Billing Contact and Billing Email columns, as well.
-
Click the Preview tab. Your report should appear as shown here.
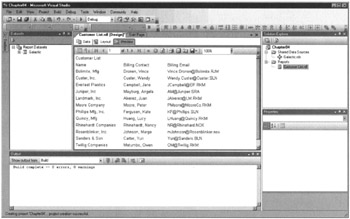
-
Repeat Steps 11 through 16 until you are satisfied with the appearance of the report.
-
When you are satisfied with the report, click the Save All button in the toolbar. This saves the project, the shared data source, and the report files. The Save All button is highlighted in the following illustration.
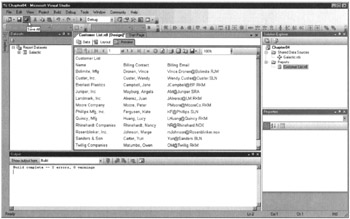
Task Notes As you may have noticed, the Choose the Table Style page offers several table style choices (refer to the illustration in Step 5). You can try these different table styles as you complete the other sample reports in this chapter and as you create your own reports using the Report Wizard. For ease of comparison between sample reports, the figures in this book will continue to use the Generic style.
The report server and deployment folder items on the Choose the Deployment Location page (refer to the illustration in Step 6) are used when the report is moved from the development environment to a report server. These items are saved with the project, not with an individual report. For this reason, the Deployment Location page is only displayed by the Report Wizard for the first report created in a project. We discuss report deployment in Chapter 10.
You probably had to repeat steps 11 through 16 of this task several times to get the report just the way you wanted it to look. This is not a problem. Most reports you create require multiple trips between the Layout and the Preview tabs before everything is laid out as it should be. Knowing you can move between layout and preview with such ease is a real plus of the Report Designer.
Congratulations! You have now completed your first report.
EAN: 2147483647
Pages: 115