Data Mining Algorithms
SQL Server 2005 provides us with seven data mining algorithms. Most of these algorithms perform several different tasks. Having a detailed understanding of the inner workings of each algorithm is unnecessary. Instead, this section provides a brief explanation of each to give you some background information. More important is the knowledge of what each can be used to accomplish.
Microsoft Decision Trees
The Microsoft Decision Trees algorithm is one of the easiest algorithms to understand because it creates a tree structure during its training process. (You probably already guessed that from the name.) The tree structure is then used to provide predictions and analysis.
Function
Figure 12-11 shows a sample decision tree created by the Microsoft Decision Trees algorithm. In this tree, we are analyzing the relationship between various product attributes and likelihood to be a high seller. Each new attribute the algorithm processes adds a new branch to the tree. In the diagram, we have a binary tree. But, using an attribute with more than two values, it is possible to have a fork with more than two branches—a N-ary tree, if you like the lingo.
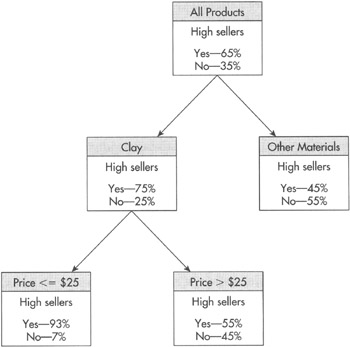
Figure 12-11: The Microsoft Decision Trees algorithm
As each node in the tree is created, the attribute we will be predicting is examined in the training data set. In Figure 12-11, 75% of products made from clay were high sellers in the training data. Further down the tree, 93% of clay products costing $25 or less, were top sellers. If you were a member of the Maximum Miniatures planning team, what new types of new products would you emphasize? (If you said clay products costing under $25, all this talk about mathematical algorithms has not yet put you in stupor and you are definitely catching on.)
Tasks
The main purpose of the Microsoft Decision Trees algorithm is
-
Classification
It can also be used for
-
Regression
-
Association
Microsoft Naïve Bayes
Microsoft's SQL Product Manager, Donald Farmer, claims because there is a Naïve Bayes algorithm, there must be a "deeply cynical" Bayes algorithm out there somewhere in data mining land. I guess it is needed to bring balance to data mining's version of the "force." We will try not to be too Naïve as we explore the benefits and shortcomings of this algorithm.
Function
The Naïve Bayes algorithm looks at each attribute of the entity in question and determines how that attribute, on its own, affects the attribute we are looking to predict. Figure 12-12 shows a Naïve Bayes algorithm being used to predict whether a customer is a good credit risk. One by one, the Naïve Bayes algorithm takes a single attribute of a customer, size of company, annual revenue, and so forth and looks at the training data to determine its effect on credit risk.
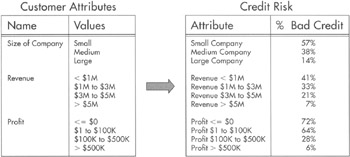
Figure 12-12: The Naïve Bayes algorithm
In our diagram, 57% of companies with a size attribute of small are bad credit risks. Only 14% of companies with a size attribute of large are bad credit risks. In this particular example, it looks pretty cut and dried: we should never extend credit to small companies and we should always extend credit to large companies.
What the Naïve Bayes algorithm does not tell us is what the results might be if we consider more than one attribute at a time. Are small companies with annual profits of more than $500,000 a bad credit risk? Are large companies with annual profits in the negative a good credit risk? The Naïve Bayes does not consider combinations of attributes, so it simply doesn't know. This is why our Naïve Bayes algorithm is so naïve!
Tasks
The Naïve Bayes algorithm can only be used for
-
Classification
Microsoft Clustering
Next on our list is the Microsoft Clustering algorithm.
Function
The Microsoft Clustering algorithm builds clusters of entities as it processes the training data set. This is shown in Figure 12-13. Once the clusters are created, the algorithm analyzes the makeup of each cluster. It looks at the values of each attribute for the entities in the cluster.
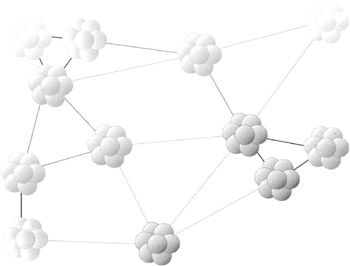
Figure 12-13: The Microsoft Clustering algorithm
When we view the Microsoft Clustering algorithm in the Business Intelligence Development Studio, we see a diagram similar to Figure 12-13. By entering the attribute value we want, we can have the clusters color-coded according to the concentration of our desired value.
For example, say we are trying to determine the distinguishing characteristics of customers who are likely to go to the competition in the next two months. We create our clusters of customers from the training data. Next, we ask the Business Intelligence Development Studio to show us the concentration of customers from the training data set who did leave within two months. The darker the cluster, the more departed customers it contains. Finally, we can examine what attributes most distinguish the high-concentration clusters from the others.
Tasks
The main purpose of the Microsoft Clustering algorithm is
-
Segmentation
It can also be used for
-
Regression
-
Classification
Microsoft Association
As the name suggests, the Microsoft Association algorithm is used for association. Therefore, to use this algorithm, we must have entities that are grouped into sets within our data. Refer to the section "Association" if you need more information.
Function
The Microsoft Association algorithm creates its own sets of entities, and then determines how often those sets occur in the test data set. This is shown in Figure 12-14. In this set, we are looking at groupings of products purchased together in a single purchase transaction. To simplify our example, we are only looking at products in the World War II product subtype.
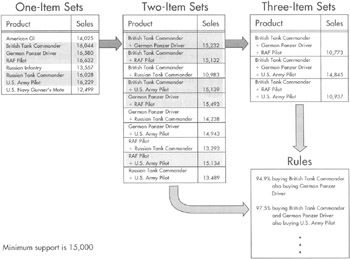
Figure 12-14: The Microsoft Association algorithm
The Microsoft Association algorithm begins by creating one-item sets. You may think it takes more than one item to make a set, but just set that aside for a moment. This algorithm then looks at how many times a purchase included the item in each one-item set.
Next, the algorithm determines which sets were popular enough to go on to the next level of analysis. For this, a particular threshold, or minimum support, is used. In Figure 12-14, the minimum support required is 15,000. In other words, a particular set must be present in at least 15,000 purchases in the test data set to move on. In our example, British Tank Commander, German Panzer Driver, RAF Pilot, Russian Tank Commander, and U.S. Army Pilot have the minimum support required.
The algorithm now repeats the process with two-item sets. The 5 one-item sets that had the minimum support at the previous level are combined to create 10 two-item sets. Now, the algorithm examines the test data set to determine how many purchases included both items in each two-item set. Again, a minimum level of support is required. In Figure 12-14, you can see we have 5 two-item sets with the minimum support required.
Items from the two-item sets are now combined to form three-item sets. This process continues until there is either one or zero sets with the minimum support. In Figure 12-14, no three-item sets have the minimum support required so, in this case, the algorithm does not continue with four-item sets.
Once the sets are created, the algorithm creates membership rules based on the result. The algorithm determined that 16,044 purchases included the British Tank Commander. Of those purchases, 15,232 or 94.9% also included the German Panzer Driver. This becomes a rule for predicting future associations. In the future, when someone puts the British Tank Commander in their shopping cart, 95 times out of 100, they will also include the German Panzer Driver in the same purchase.
Tasks
The Microsoft Association algorithm can only be used for
-
Association
Microsoft Sequence Clustering
The Microsoft Sequence Clustering algorithm is a new algorithm developed by Microsoft Research. As the name implies, the Microsoft Sequence Clustering algorithm is primarily used for sequence analysis, but it has other uses as well.
Function
The Microsoft Sequence Clustering algorithm examines the test data set to identify transitions from one state to another. The test data set contains data, such as a web log showing navigation from one page to another or perhaps routing and approval data showing the path taken to approve each request. The algorithm uses the test data set to determine, as a ratio, how many times each of the possible paths is taken.
Figure 12-15 shows an example of the sequence cluster diagram that results. In the diagram, we can see that if in state A, 35 times out of 100 there will be a transition to state B, 30 times out of 100 there will be a transition to state C, and 15 times out of 100 there will be a transition to state D. The remaining 20 times out of 100, it remains in state A. These ratios discovered by the algorithm can be used to predict and model behavior.
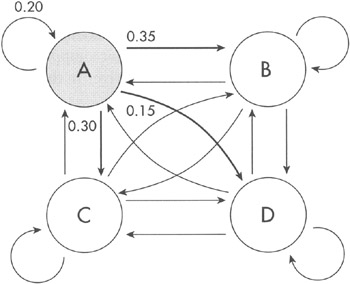
Figure 12-15: The Microsoft Sequence Clustering algorithm
Tasks
The main purpose of the Microsoft Sequence Clustering algorithm is
-
Sequence Analysis
-
Segmentation
It can also be used for
-
Regression
-
Classification
Microsoft Time Series
The Microsoft Time Series algorithm is used for analyzing and predicting time-dependent data. It makes use of a structure called an autoregression tree, developed by Microsoft.
Function
The Microsoft Time Series algorithm starts with time-related data in the test data set. In Figure 12-16, this is sales data for each month. To simplify things, we are only looking at data for two products in our example.
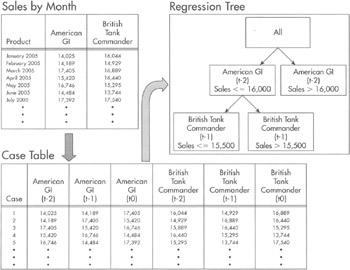
Figure 12-16: The Microsoft Time Series algorithm
The sales data is pivoted to create the table at the bottom of Figure 12-16. The data for case 1 is for March 2005. The sales amounts in (t0) columns for this case come from the March 2005 sales figures. The sales amounts in the (t-1), or time minus one month, columns come from February 2005 and the sales amounts in the (t-2) columns come from January 2005. Case 2 shifts the months ahead one, so (t0) becomes April, (t-1) becomes March, and (t-2) becomes February.
The algorithm then uses the data in this pivot table to come up with mathematical formulas that use the numbers from the (t-1) and (t-2) columns to calculate the number in the (t0) column for each product. Don't ask me how it does this, but it does it. Using these formulas, we can predict the sales values for a product into the future.
With something as complex as predicting the future, you can understand that a single formula for each product is probably not going to do the trick. This is where the autoregression tree comes into play. The autoregression tree is shown in the upper-right corner of Figure 12-16. The autoregression tree allows the algorithm to set up conditions for choosing between multiple formulas for making a prediction. Each node in the autoregression tree has its own formula for making a prediction. In the figure, we have one formula when sales for the American GI at (t-2) are less than or equal to 16,000 and another formula where sales are over 16,000.
Don't worry; we don't need to know how to create autoregression trees or the formulas they contain. All we need to know is how to use them. We will see how to do this in Chapter 13 and Chapter 14.
Tasks
The Microsoft Time Series algorithm can only be used for
-
Regression
Microsoft Neural Network
Neural networks were developed in the 1960s to model the way human neurons function. Microsoft has created the Microsoft Neural Network algorithm, so we can use neural networks for such mundane activities as predicting product sales. Of course, predicting product sales might not seem so mundane if your future employment is dependent on being correct.
Function
The Microsoft Neural Network algorithm creates a web of nodes that connect inputs derived from attribute values to a final output. This is shown in Figure 12-17. Each node contains two functions. The combination function determines how to combine the inputs coming into the node. Certain inputs might get more weight than others when it comes to affecting the output from this node
The second function in each node is the activation function. The activation function takes input from the combination function and comes up with the output from this node to be sent to the next node in the network.
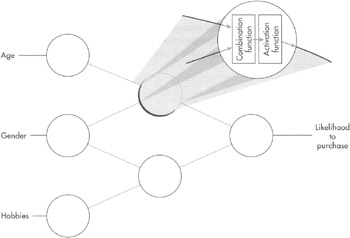
Figure 12-17: The Microsoft Neural Network algorithm
Again, don't ask me how the algorithm comes up with the functions for each node. Some very smart people at Microsoft and elsewhere figured that out for us already. All we need to do is use the algorithm and reap the rewards.
Tasks
The main purpose of the Microsoft Neural Network algorithm is
-
Classification
-
Regression
EAN: 2147483647
Pages: 112