The Business Intelligence Development Studio
The Business Intelligence Development Studio is our primary work environment for almost this entire book. All the work we do creating and querying OLAP structures, all the work we do building and training data mining models, and all the work we do developing reports will be done in the Business Intelligence Development Studio. Because of this, it is important to become comfortable with the interface and capabilities of the Business Intelligence Development Studio.
Visual Studio
The Business Intelligence Development Studio is, in fact, Visual Studio, the same integrated development environment (IDE) used by Visual Basic, C#, and C++ developers. Visual Studio is also used to author reports for use with SQL Server 2000 Reporting Services. Visual Studio provides the business intelligence developer with a robust environment that has been tested and proven by millions of developer hours of use.
Project Organization
Visual Studio organizes each development effort into projects. Each project produces its own type of output: a Windows application, a web service, or a set of Reporting Services reports. SQL Server 2005 adds two additional project types: an Integration Services package and an Analysis Services project.
Projects are grouped together in solutions. Each solution represents a solution to a particular business problem. A solution could be an e-commerce web site with a Visual Basic web application project to produce the ASP.NET user interface pages and an Analysis Services project to define the data mining model used to do cross-selling. Another solution might contain a complete business intelligence application with a C# windows application project to produce the front-end application, an Analysis Services project to create the OLAP structures, and a Reporting Services project that produces reports for presenting the analysis to the user. This grouping of projects into solutions makes it easier to manage software systems built from several different parts.
Editing and Debugging Tools
Visual Studio also provides a rich set of editing and debugging tools. Some of you may say that color-coded editors and single-step debugging are only for wimps. After all, the editor in SQL Server 2000 Enterprise Manager and embedding PRINT statements in stored procedures have worked fine up until now. Believe me, once you have these tools available, you will never want to go back!
Source Code Management Integration
Another benefit of using the Visual Studio environment for BI projects is source control. Source control copies the source code for your item definitions and report layouts to a central database. Source control then manages access to those definitions and layouts to provide version control and prevent two developers from trying to change the same item at the same time.
Each version of these items is saved. This makes it possible for us to roll back changes if we discover we have gone down the wrong path. It also makes it possible to determine what changed between two versions of an item. This can be helpful for troubleshooting or when copying changes from one server to another.
Source code also enables multiple developers or administrators to work on the same project at the same time without the danger of one person overwriting another's changes. You must check out an item from source control before you can edit it. Only one person can have a given item checked out at a given time. Once changes are made, the item is checked back in for the next person to use.
Visual Studio makes this check-out and check-in process straightforward. In fact, it is simply part of the editing process itself. No additional applications to open. No extra steps writing things out to temporary files.
Navigating the Business Intelligence Development Studio
The Business Intelligence Development Studio is found on the Start menu under Microsoft SQL Server 2005 as shown in Figure 5-1. After the splash screen, you see the empty Business Intelligence Development Studio. No solution has been opened.

Figure 5-1: Business Intelligence Development Studio on the Start menu
In this section, we create a solution and an Analysis Services project within that solution. Then, we explore the menus, toolbar, and windows within the Business Intelligence Development Studio. In the next section, we look at some of the ways to customize this development environment.
Creating a Solution and an Analysis Services Project
The empty Business Intelligence Development Studio is not too exciting. Therefore, we begin by creating a solution and an Analysis Services project within that solution. We can then explore all of the windows, menu choices, and toolbar buttons available to us when working in this type of project.
In the Business Intelligence Development Studio, we do not choose to create a solution. Instead, we create a new project. At the same time that project is created, we can create the solution that will contain that project.
We can create a new project in the Business Intelligence Development Studio in four ways:
-
Select File | New | Project from the menu.
-
Press CTRL-SHIFT-N.
-
Click the New Project button on the toolbar as shown in Figure 5-2.
-
Click the Create: Project link in the Recent Projects portion of the Start tab.
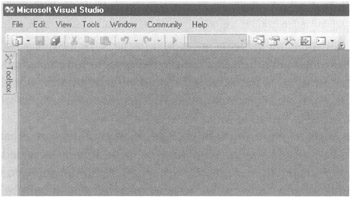
Figure 5-2: The New Project Toolbar button
No matter how you get there, once you request a new project, you see the New Project dialog box shown in Figure 5-3. The left side of the dialog box contains a list of the Visual Studio project types installed on your development machine. In this book, we are interested in Business Intelligence Projects. Click on this project type to select it, if it is not already highlighted.
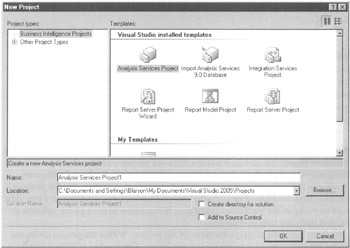
Figure 5-3: The New Project dialog box
The right side of the dialog box displays the various BI projects available to us. These can be displayed as large icons or as small icons as shown in Figure 5-3. You can toggle between the two sizes using the buttons in the upper-right corner of the dialog box.
The lower portion of the dialog box displays the path and filename for the project we are about to create. Name is the name of the new project. Location is the file path where the new solution and project are to be stored. Solution Name is the name of the new solution.
By default, solutions and projects are stored in the Visual Studio 2005 Projects folder under My Documents. You can use the Browse button to navigate to a different folder, if desired. When Create Directory for Solution is not checked, only one folder is created. Both the new solution files and the new project files are placed in this folder.
When Create Directory for Solution is checked, two folders are created. One folder is created to hold the solution files and a second folder is created within this solution folder to contain the project files. By default, the solution folder and the project folder have the same name. You can override this default behavior by entering a unique name for both the Name and the Solution Name. If the solution is going to contain more than one project, it is usually a good idea to keep the solution files and the project files in separate folders.
If Visual Source Safe is installed on your PC, we also have the option of placing the project under source control. This is accomplished by checking Add to Source Control. If you are going to use source control for your BI projects, it is a good idea to use this check box to place them under source control right from the start.
To create our empty Analysis Services project, select Business Intelligence Projects for the project types, select Analysis Services Project for the template, and click OK.
Business Intelligence Development Studio Windows
Now that we have a solution and a project open, the Business Intelligence Development Studio appears as shown in Figure 5-4. We now have some content in the two windows that are open on the right side of the main window. We can begin by looking at these two windows, and then at several other windows that are not visible by default.
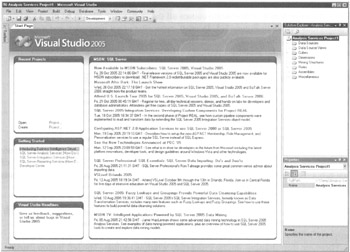
Figure 5-4: The Business Intelligence Development Studio with an empty Analysis Services project
Solution Explorer Window The Solution Explorer window is visible in the upper-right portion of Figure 5-4. Just as Windows Explorer provides a hierarchical view of the Windows file system, the Solution Explorer window in the Business Intelligence Development Studio provides a hierarchical view of your solution and the projects it contains. Both Windows Explorer and the Solution Explorer window use a tree view to let us navigate the hierarchical structure. We can browse through our solution to find and open any item it contains.
Each project node displays the name of the project. Within the project nodes are folders for each type of item the project can create. The number of folders and their labels vary depending on the project type. In Figure 5-4, you can see that an Analysis Services project contains eight folders, one for each of the eight different types of items it can create.
In addition to the toolbar at the top of the Business Intelligence Development Studio (where we found the New Project button), each window has its own toolbar as well. The content of this toolbar varies, depending on which item or folder is selected. The leftmost toolbar button shown in the Solution Explorer window in Figure 5-4 is the Properties button. If this toolbar button is clicked when a project node is highlighted, the Project Property Pages dialog box is displayed.
Most other items in the solution do not have their own custom property pages dialog boxes. Instead, these items display their properties in the Properties window, which we discuss next. Clicking the Properties button in the Solution Explorer toolbar when any of these other items is highlighted causes the Properties window to gain focus.
The other button shown on the Solution Explorer toolbar in Figure 5-4 is the Show All Files toggle. This toggle causes all the supporting files to be displayed for a project, as shown in Figure 5-5. In most cases, this is not necessary and toggling it on clutters up the Solution Explorer. However, at times it is helpful to know exactly which files are being used by a project.
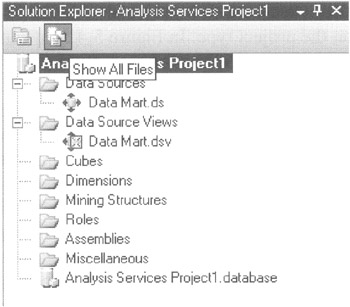
Figure 5-5: The Solution Explorer window with the View Code and View Designer Toolbar buttons
Properties Window Below the Solution Explorer window in Figure 5-4 is the Properties window. This window displays the property settings of the item highlighted in the Solution Explorer window. The drop-down list at the top of the Properties window shows the name of the item whose properties are currently displayed.
The main portion of the Properties window is composed of a list with two columns. The left column shows the name of each property. The right column shows the current value of that property. If the text in the right column is black, the value of that property can be changed in the Properties window. If the text in the right column is gray, the value is read-only.
The lower portion of the screen provides a little more information about the selected property. The name of the selected property is displayed in bold, along with a description of this property. This description can often help users understand a property without having to consult the online help.
There are three buttons on the Properties window toolbar. The left button causes the properties to be displayed by category. The category headings are shown as light gray bands within the properties list. Figure 5-6 shows the properties of the Data Mart data source. These properties are divided into two categories: Location and Object Model.
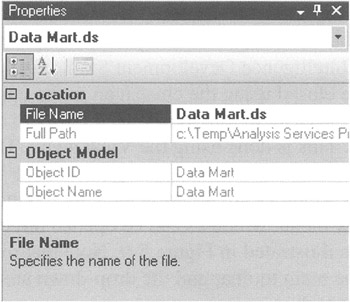
Figure 5-6: The Properties window with categorized properties
The middle button on the Properties window toolbar causes the properties to be displayed in one continuous, alphabetical list without any grouping. Personally, I never remember which grouping contains the property I want to see, so I use the alphabetical list setting. However, you may find it more helpful to have properties grouped. Use whichever setting works best for you.
The right button on the Properties window toolbar displays the Property Pages for the selected item. However, only some items have a Property Pages dialog associated with them. Therefore, this toolbar button does not function for all items.
Toolbox Window On the left side of Figure 5-4 is a tab labeled Toolbox. This tab provides access to the Toolbox window, which is set to auto hide. The auto hide setting causes the window to remain out of the way until it is needed. A window that is set to auto hide can be displayed by hovering the mouse pointer over the window's tab as shown in Figure 5-7.
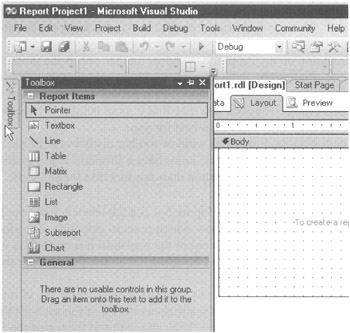
Figure 5-7: Displaying the Toolbox window when it is set to auto hide
The auto hide feature is controlled by the pushpin icon at the top of the window. When auto hide is on, the pushpin is sideways as shown in Figure 5-7. When auto hide is off, the pushpin is vertical. You can see this at the top of the Solution Explorer and Properties windows in Figure 5-4. To toggle the auto hide setting for a window, click on its pushpin icon.
The Toolbox window contains components used to build items in our projects. The contents of the Toolbox window change to match the type of item being built. It contains data transformation tasks when we are creating Data Integration Services packages. The Toolbox window contains report items when we are building Reporting Services reports. The toolbox for report designing is shown in Figure 5-7.
Opening Windows Not Visible in the Business Intelligence Development Studio Any window in the Business Intelligence Development Studio, including the three already discussed, can be closed using the close icon in the upper-right corner of the window. Because this is the case, we obviously need a way to open a window that is not visible on the screen. This is done using the View menu. The Solution Explorer, Properties, and Toolbox windows are available right from the View menu, as shown in Figure 5-8. Additional windows are found in the Other Windows submenu.
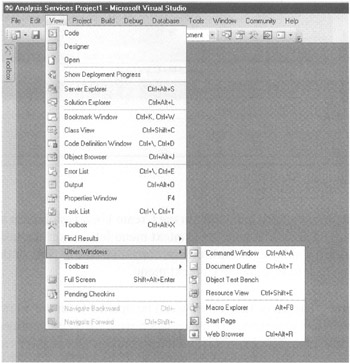
Figure 5-8: The View menu
In addition to the View menu, windows can be opened directly from the toolbar. These toolbar buttons are illustrated in Figure 5-9. Note that the Command Window button appears in both the main toolbar and the drop-down area. Both of these buttons perform the same task.
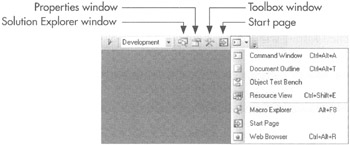
Figure 5-9: Toolbar buttons for opening Business Intelligence Development Studio windows
Task List Window The Task List window can be opened from either the View menu or the toolbar. This window provides a convenient place for us to make note of to-do items for this solution. We can assign priorities that are signified by the exclamation point (high priority), blank (normal priority), and down arrow (low priority). When items are completed, they can be checked off. Completed items are displayed with a strike-through. The Task List window is shown in Figure 5-10.
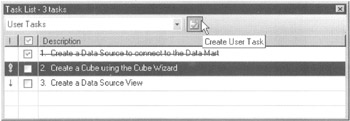
Figure 5-10: The Task List window
To add an item to the task list, click on the Create User Task button as shown in Figure 5-10. The Task List window Context menu lets us sort the tasks, control which columns are displayed in the window, copy an existing task, or delete a task. Right-click on a task to display the Context menu.
Error List Window The Error List window can be opened from the View menu. In addition, this window automatically opens when we try to build a project or solution and there are problems. The Error List window contains an entry for each error, warning, and message that was produced during the build. The Error List window is shown in Figure 5-11.

Figure 5-11: The Error List window
Double-clicking on an entry in the Error List window causes the Business Intelligence Development Studio to open the item that caused the error, warning, or message. This makes it easy to fix a number of build errors that have occurred in various items distributed across several projects. As with the Task List window, right-clicking on an entry in the Error List window displays a Context menu for controlling the sorting and display order of the error list entries.
Output Window The Output window can be opened from the View menu. In addition, this window automatically opens when we try to build a project or solution. The Output window contains a narrative of the events that occurred during the most recent build attempt. The Output window is shown in Figure 5-12.

Figure 5-12: The Output window
Like the Error List window, the Output window notes errors, warnings, and messages from the last build attempt. Unlike the Error List window, the Output window also notes successful tasks completed. The Output window includes toolbar buttons for clearing its contents and for toggling word wrap within the window.
Find Results Windows The Find Results windows can be opened from the View menu. In addition, one of these windows automatically opens whenever we perform a Find in Files or a Replace in Files operation. The Find Results 1 window is shown in Figure 5-13.
![]()
Figure 5-13: The Find Results 1 window
When we execute a find or replace operation, we can choose to display the results in either the Find Results 1 window or the Find Results 2 window. In this way, we can move between the results of two different find operations. The Find Results window contains a list of all of the places where the desired text was found. We can move to any of these locations by double-clicking on that line in the Find Results window.
Designer Window All of the windows we have discussed so far are usually found along the left, right, top, or bottom edge of the Business Intelligence Development Studio (although they don't have to be, as we discuss in the next section). That leaves us with the large area in the center. This area is occupied by the Designer window.
The Designer window appears any time we view the code or the design of an item. In fact, the Designer window is where most of the work of creating business intelligence gets done. Figure 5-14 shows the Designer window with several designers and source code editors open (note the three tabs across the top). The Cube designer is open for the Min Max Sales cube. The Data Source View designer is open for the Min Max Sales DV data view. The Dimension source code editor is open for the store dimension. (We can tell this is a source code editor rather than a designer because of the "[XML]" in the tab. We talk more about code editors and designers throughout the rest of this book.)
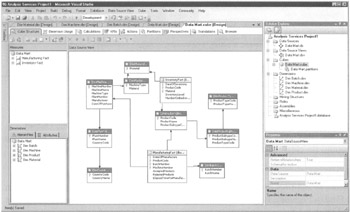
Figure 5-14: The Designer window with the Dimension, Cube, and Data Source View designers open
A tab is created each time an item is opened in a code editor or a designer. The tabs enable us to move quickly from one item's designer or source code editor to another item's designer or source code editor with a single click. We can open an item's designer by doing one of the following:
-
Selecting the item in the Solution Explorer window, and then selecting View | Designer from the Main menu.
-
Right-clicking the item in the Solution Explorer window and selecting View Designer from the Context menu.
-
Double-clicking the item in the Solution Explorer window.
We can open an item's code editor by doing one of the following:
-
Selecting the item in the Solution Explorer window, and then selecting View | Code from the Main menu.
-
Right-clicking the item in the Solution Explorer window and selecting View Code from the Context menu.
We can close an item's designer or code editor by selecting the appropriate tab, and then clicking the Close button (the X) to the right of the tabs.
We discuss each designer and code editor as we use them to create and modify the various items in the Business Intelligence Development Studio.
Window Management
The windows of the Business Intelligence Development Studio can be rearranged any way that we like. This is done by setting various windows to be docked along the sides or bottom, to float, or to auto hide. In this way, each person can arrange the windows to suit their development style.
Each window can be set to one of five states:
-
Floating
-
Dockable
-
Tabbed Document
-
Auto Hide
-
Hide
We can set a window's state by selecting that window, and then selecting Floating, Dockable, Tabbed Document, Auto Hide, or Hide from the Window menu. Alternately, we can right-click the title bar of a window and set its state using the Context menu. This is shown in Figure 5-15.
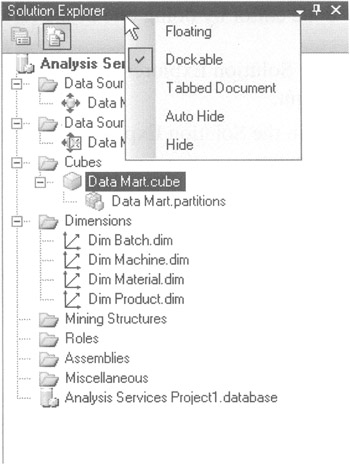
Figure 5-15: Changing a window's state
Floating Windows When a window's state is set to floating, it exists as a separate floating window on top of the rest of the Business Intelligence Development Studio windows. A floating window can be moved anywhere around the screen on top of any other part of the user interface. This is shown in Figure 5-16.
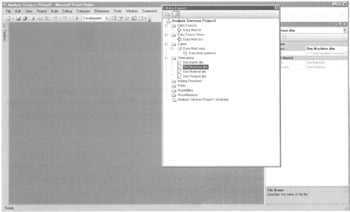
Figure 5-16: The Solution Explorer as a floating window
Dockable Windows When a window's state is set to dockable, it is able to dock with the left, right, top, or bottom edge of the Business Intelligence Development Studio. After a floating window's state is set to dockable, the window may be dragged to a docking position. To drag a dockable window, click on the window's title bar and hold down the left mouse button while you move the window into the appropriate place.
As soon as you begin dragging the window, several blue docking guides appear on the screen. These docking guides make it easy to dock the window in the desired location. The docking guides are linked to each of the possible docking locations on the screen.
By moving the mouse pointer over one of the docking guides while dragging a dockable window, we can see exactly where that window is going to dock if the mouse button is released at that point. The possible docking location linked to the docking guide under your mouse pointer displays as a blue shadow on the screen. If this is not the desired docking location, we can drag the window to another docking guide. When we find the docking guide linked to the desired location, we simply release the mouse button and the window docks in the selected location.
There are docking guides for the top, bottom, left, and right sides of the Business Intelligence Development Studio. Using one of these docking guides, we can dock the window along the entire length of that side. Any other windows that might butt up against that side are moved out of the way. Also, a set of docking guides in the form of a diamond is in the center of the current window. Using one of the docking guides at the points of this diamond docks the window at the side of this current window. As we drag from one window to another, this diamond-shaped docking guide switches, so that it is always in the center of the window we are dragging over.
In the center of the diamond is a tabbed-icon docking guide. Using this tabbed-icon docking guide causes the window being docked to fill the current window. The two windows now form a tabbed grouping. Figure 5-17 shows the Properties window and the Solution Explorer window combined to create a tabbed grouping. Note the tabs at the bottom of the window for switching between the Solution Explorer and the Properties window. To remove a window from a tabbed grouping, simply click on that window's tab, hold down the left mouse button, and drag the window away.
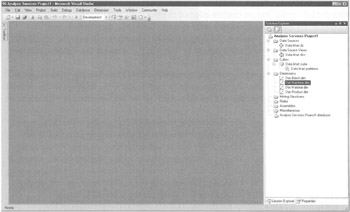
Figure 5-17: The Properties window and the Solution Explorer window combined in a Tabbed window
Tabbed Document You can even create a tabbed grouping with the Designer window. In Figure 5-18, the Solution Explorer is part of the tabbed grouping in the Designer window. When this is done, the window's state changes from dockable to tabbed document. Remember, this is only true when a window is in a tabbed group in the Designer window. A window in a tabbed group outside of the Designer window continues to have a dockable window state.
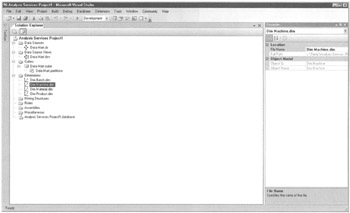
Figure 5-18: The Solution Explorer window in a tabbed grouping on the Designer window
Auto Hide We have already seen the behavior of an auto hide window when we examined the Toolbox window. Note, a window's state cannot be changed to auto hide unless it is already docked. A window must have auto hide turned off, using the pushpin icon, before it can be changed to another state.
Hide The final window state is the simplest one of all. This is the hide state. When a window is in the hide state, it is closed and no longer appears on the screen. If we want to view a hidden window, we need to use the Windows menu or the toolbar, as discussed previously.
Business Intelligence Development Studio Options
In addition to the capability to rearrange the windows to our liking, the Business Intelligence Development Studio can also be customized using the Options dialog box. The Options dialog box is accessed by selecting Tools | Options from the Main menu. The Options dialog box is shown in Figure 5-19.
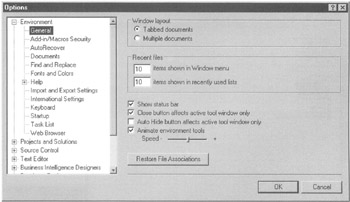
Figure 5-19: The Options dialog box
The Options dialog box provides the capability to modify a great number of settings for the Business Intelligence Development Studio. We only discuss a few of those settings here. Feel free to explore this dialog further on your own to learn about more of the customization options.
MDI Environment
The first option we look at is in the Environment | General options shown in Figure 5-19. At the top of the dialog box are two radio buttons: Tabbed documents and Multiple documents. These radio buttons control the behavior of the Designer window. As we discussed earlier, each designer and code editor opened in the Designer window becomes a tab. This is the default behavior of the Designer window, but it is not the only option.
If you are more comfortable with a multidocument interface (MDI) from previous versions of Visual Studio or from Microsoft Office products, you can switch the Designer window from using tabbed documents to using MDI. Simply click the Multiple documents radio button and click OK to exit the dialog box. Once this is done, the Designer window looks similar to Figure 5-20. For the remainder of this book, however, we use the Designer window with its default, tabbed document setting.
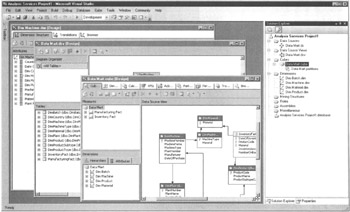
Figure 5-20: The Designer window with an MDI interface
Fonts and Colors
Further down under the Environment options is the Fonts and Colors entry. This area lets us customize the font and color used for any category of text within the Business Intelligence Development Studio. This is shown in Figure 5-21. The fonts and colors options can be used to change font size or typeface to make certain items more readable. They can also be used to change the color of a particular set of text to make it stand out.
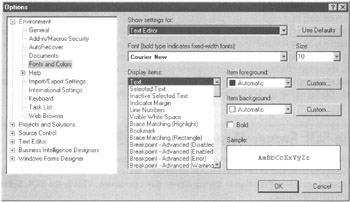
Figure 5-21: Fonts and Colors options
To make a change, we first make a selection from the Show Settings For drop-down list. Next, we select the text we want to change from the Display Items list. Finally, we make the desired font and color changes, and then click OK to apply the changes.
Default File Locations
Another area that often needs customizing is the default location for creating solution and project files. This can be changed in the General area under Projects and Solutions, as shown in Figure 5-22. The path in the Visual Studio projects location textbox is the default location for creating new solutions and projects. To change this, we simply browse to or type in a new path and click OK to apply the changes. Now whenever the New Project dialog box is displayed, Location shows our updated path. (Refer to Figure 5-3 for another look at the New Project dialog box.)
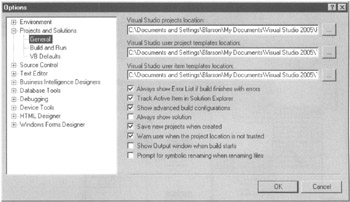
Figure 5-22: Projects and Solutions—General options
EAN: 2147483647
Pages: 112