Online Analytical Processing
In 1993, E. F. Codd, one of the fathers of relational database and OLTP theory, proposed a different type of system that would be tuned to the needs of data analysts. He called this an online analytical processing or OLAP system. The criteria Codd originally laid out for an OLAP system were not widely accepted. However, the OLAP name continues to be used for systems designed to quickly provide users with business intelligence.
| Definition | Online Analytical Processing (OLAP) systems enable users to quickly and easily retrieve information from data, usually in a data mart, for analysis. OLAP systems present data using measures, dimensions, hierarchies, and cubes. |
As the first word—Online—in the name implies, OLAP is designed to let the user interact with the data during analysis. OLAP is geared toward having the user online with the data, slicing and dicing the data to view it in different ways, drilling down into the data to see more detail. This is a different approach from the static reports produced by most OLTP systems.
Building OLAP—Out of Cubes
An OLAP system is designed to provide its users with quick and easy access to business data. That data is usually stored in a data mart. The OLAP system simply provides a mechanism for viewing and analyzing the data mart information quickly. Within the OLAP system, the business data takes the form of measures, dimensions, hierarchies, and cubes.
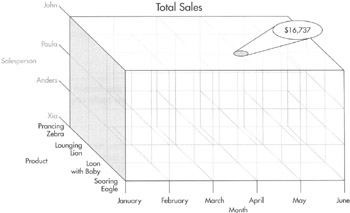
In fact, OLAP systems focus on cubes. We briefly discussed cubes in Chapter 3. Before we get into the specifics of OLAP systems, let's take a more detailed look at cubes. We, again, create a cube using the total sales measure. This time, we use month, product, and salesperson as our dimensions. The resulting cube is shown in Figure 4-1.

Figure 4-1: Total Sales cube
| Definition | A Cube is a structure that contains a value for one or more measures for each unique combination of the members of all its dimensions. These are detail or leaf-level values. The cube also contains aggregated values formed by the dimension hierarchies or when one or more of the dimensions is left out of the hierarchy. |
Within the cube is a measure value for each intersection of members of the three dimensions. Figure 4-1 illustrates the total sales for the Loon with Baby figurine by John in April. Loon with Baby is a member of the product dimension. John is a member of the salesperson dimension. April is a member of the month dimension. The total sales at this intersection is $16,737.
A measure value that exists at an intersection of all of the dimensions is called a detail or leaf-level value. In Figure 4-1, total sales for the Loon with Baby figurine by John in April is an example of a leaf-level value. This is a leaf-level value because members (John, April, and Loon with Baby) are specified for each dimension (salesperson, month, and product).
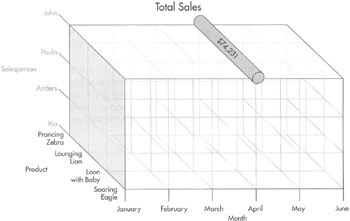
To determine the total sales by John in April, we need to add together John's total sales of each individual product in April. In other words, John's total sales for April are equal to John's total sales of Soaring Eagle in April, plus John's total sales of Loon with Baby in April, plus John's total sales of Lounging Lion in April, plus John's total sales of Prancing Zebra in April. In OLAP terminology, we aggregate all the leaf-level values from the product dimension using the sum aggregation. This is shown in Figure 4-2.

Figure 4-2: Total Sales cube with an aggregation for John's total sales for April
| Definition | An Aggregate is a value formed by combining values from a given dimension or set of dimensions to create a single value. This is often done by adding the values together using the sum aggregate, but other aggregation calculations can also be used. |
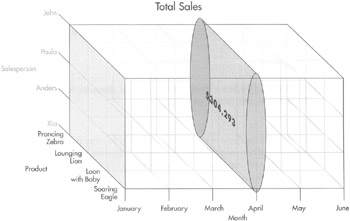
To determine the total sales for April for all salespersons, we need to do another aggregation. This time, we need to aggregate all the total sales for all the salespersons across all the products they sold in April. See Figure 4-3.

Figure 4-3: Total Sales cube with an aggregation for total sales for all salespersons for April
We also use aggregate values within the cube when we traverse the hierarchy of one or more dimensions. Recall that salespersons can be grouped or rolled up into sales regions, products can be rolled up into product subtypes and product types, months can be rolled up into quarters and years. Each time one level of a hierarchy is rolled up into a higher level, aggregations are used to combine values from the lower level into the groupings at the upper level. For example, the total sales for the Loon with Baby figurine by John in Quarter 1 would be the total sales for the Loon with Baby figurine by John in January, plus the total sales for the Loon with Baby figurine by John in February, plus the total sales for the Loon with Baby figurine by John in March.
You can see that cubes with a number of dimensions and a number of hierarchies require quite a few aggregate calculations as the user navigates through the cube. This can slow down analysis to a large extent. To combat this, some or all of the possible data aggregates in the cubes are calculated ahead of time and stored within the cube itself. These stored values are known as preprocessed aggregates.
Features of an OLAP System
An OLAP system offers many advantages for us as we seek to produce business intelligence. It provides an architecture that is focused on the presentation of information for analysis. This focus makes the OLAP system a natural environment for users looking to use information for effective decision making.
Multidimensional Database
An OLAP system is built around data that is structured as measures, dimensions, hierarchies, and cubes. This multidimensional approach makes it easy for users to slice and dice information as needed. Users can use dimensions to view the data in different ways. They can use hierarchies to drill into the data and find more detail when needed.
| Definition | A Multidimensional Database is structured around measures, dimensions, hierarchies, and cubes rather than tables, rows, columns, and relations. |
A multidimensional database is the most natural way to store information used for business intelligence, when measures are analyzed by dimensions. Aside from this innate fit, the multidimensional database offers another big advantage. It provides the structure for storing preprocessed aggregates.
Preprocessed Aggregates
In a data mart, when a decision maker wants to see the value of a measure for a certain set of dimension members, that value must be calculated on the fly. The decision maker must wait while the aggregate value is calculated from all the detail information that rolls up into that aggregate. This can cause a significant delay that distracts from productive research and leads to frustration.
If the goal of an OLAP system is to get the decision maker to interact with the data, then aggregates must be returned quickly. For this reason, OLAP systems preprocess a portion of the aggregates that are found throughout the cube. This preprocessing is done as part of the background task that loads or updates the data in the OLAP database. Because this is done as part of a background task, the time taken to do the preprocessing does not impact any users. As the aggregates are preprocessed, they are stored within the cube in the multidimensional database.
Now, when a decision maker wants to see the value of a measure for a certain set of dimensional members, that value can be read from the database rather than being calculated on the fly. This greatly improves the responsiveness of the system, which, in turn, encourages online interaction and provides the decision maker with a higher probability of finding the correct piece or pieces of information necessary to make an effective decision.
Easily Understood
In OLTP systems, the data is normalized and dependencies are represented by complex foreign key relationships; the goal is to reduce redundant data. Any decision maker querying this data must reconstruct the dependencies with the appropriate inner and outer joins. Business rules that define the way a measure is to be calculated are kept in programmatic structures that are used for transaction processing, not reporting. When including a measure, the decision maker must recreate these calculations each time they are used in a report.
Fields and tables in an OLTP system are given names that make sense to the developer, but not necessarily the end user. The database system may impose a limit on the length of a name or the database administrator may not like typing long names in his maintenance scripts. In either case, the result is cryptic abbreviations in field and table names. The decision maker must decipher the code to be sure the correct data is being queried from the tables.
In an OLAP system, just the opposite is true. The structure of the data is represented by dimensions and hierarchies. If the OLAP system is designed properly, these dimensions and hierarchies should match the structure of the organization. Thus, the data structure is familiar to the decision maker using the system.
The business rules that pertain to each measure in the OLAP system are contained within the calculation defined for that measure. The user does not need to re-create this calculation each time that particular measure is used. For example, suppose your organization defines net profit as:
Selling Price - (Cost of Materials + Cost of Labor + Sales Commmissions)
In a relational environment, net profit might be incorrectly reported as
Selling Price - (Cost of Materials + Cost of Labor)
in one place and as
Selling Price - (Cost of Materials + Sales Commissions)
in another. This inconsistency can lead to confusion and, worse yet, poor decisions. In the OLAP system, the measure for net profit is defined in one place, so it is always calculated properly whether the decision maker is looking at net profit by product, net profit by month, or net profit by sales region.
Finally, because the OLAP system exists solely for producing business intelligence, all of the measures, dimensions, and hierarchies are given names that can be easily understood by the decision maker. In many cases, an OLAP system allows additional metadata, such as a long description, to be stored along with the name of the object. This provides the decision maker with enough information to insure they know exactly what business information they are looking at.
Architecture
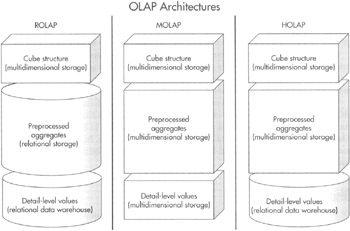
The key part of the OLAP system is the cube and the preprocessed aggregates it contains. OLAP systems typically use one of three different architectures for storing cube data. Each architecture has certain advantages and disadvantages. The basics of each architecture are shown in Figure 4-4.

Figure 4-4: OLAP Architectures
Relational OLAP
Relational OLAP (ROLAP) stores the cube structure in a multidimensional database. The leaf-level measures are left in the relational data mart that serves as the source of the cube. The preprocessed aggregates are also stored in a relational database table.
When a decision maker requests the value of a measure for a certain set of dimension members, the ROLAP system first checks to determine whether the dimension members specify an aggregate or a leaf-level value. If an aggregate is specified, the value is selected from the relational table. If a leaf-level value is specified, the value is selected from the data mart.
A ROLAP architecture, because of its reliance on relational tables, can store larger amounts of data than other OLAP architectures. Also, because the ROLAP architecture retrieves leaf-level values directly from the data mart, the leaf-level values returned by the ROLAP system are always as up-to-date as the data mart itself. In other words, the ROLAP system does not add latency to leaf-level data. The disadvantage of a ROLAP system is that the retrieval of the aggregate and leaf-level values is slower than the other OLAP architectures.
Multidimensional OLAP
Multidimensional OLAP (MOLAP) also stores the cube structure in a multidimensional database. However, both the preprocessed aggregate values and a copy of the leaf-level values are placed in the multidimensional database as well. Because of this, all data requests are answered from the multidimensional database, making MOLAP systems extremely responsive.
Additional time is required when loading a MOLAP system because all the leaf-level data is copied into the multidimensional database. Because of this, times occur when the leaf-level data returned by the MOLAP system is not in sync with the leaf-level data in the data mart itself. A MOLAP system, therefore, does add latency to the leaf-level data. The MOLAP architecture also requires more disk space to store the copy of the leaf-level values in the multidimensional database. However, because MOLAP is extremely efficient at storing values, the additional space required is usually not significant.
Hybrid OLAP
Hybrid OLAP (HOLAP) combines ROLAP and MOLAP storage. This is why we end up with the word "hybrid" in the name. It tries to take advantage of the strengths of each of the other two architectures, while minimizing their weaknesses.
HOLAP stores the cube structure and the preprocessed aggregates in a multidimensional database. This provides the fast retrieval of aggregates present in MOLAP structures. HOLAP leaves the leaf-level data in the relational data mart that serves as the source of the cube.
This leads to longer retrieval times when accessing the leaf-level values. However, HOLAP does not need to take time to copy the leaf-level data from the data mart. As soon as the data is updated in the data mart, it is available to the decision maker. Therefore, HOLAP does not add latency to the leaf-level data. In essence, HOLAP sacrifices retrieval speed on leaf-level data to prevent adding latency to leaf-level data and to speed the data load.
Disadvantages
OLAP systems have a number of advantages that make them desirable tools for producing business intelligence. However, drawbacks exist in OLAP systems that must be dealt with.
Complexity to Administer
OLAP systems provide a comfortable environment for the end user. To attain that ease of use, a certain amount of complexity is shifted to the developer and administrator. This complexity increases the level of knowledge required to create business intelligence systems.
All of the dimensions, hierarchies, and measures need to be identified and created. These items must then be organized into cubes. This requires an intimate knowledge of the organization, its goals, and its operation. In addition, the development and maintenance team must be competent with the data mart and OLAP tools selected for the project.
Of course, as the knowledge and experience requirements for the development and maintenance team increase, so does the cost. Business intelligence projects can be extremely expensive because of the high-priced expertise that must be assembled to get the project done right. This factor alone has prevented a number of organizations from pursuing business intelligence undertakings.
Data Mart Required
In most cases, an OLAP system requires a data mart with a star or snowflake layout. Data must be copied from the OLTP systems into the data mart. Scheduled routines need to be created to perform this data copy along with any data cleansing necessary to get it ready for use. If any of the OLTP systems change, the corresponding copy and cleansing routines need to be changed as well.
Latency
Because a data mart is required by OLAP, there is automatically some latency in the business intelligence. Time is required to run the routines that copy the data from the OLTP systems to the data mart. Furthermore, we probably do not want these copy routines running constantly. Instead, they are run at scheduled intervals. Between the times that the copy routines run, the data in the warehouse can get old or "stale."
Read-Only
In some cases, it is desirable to update a piece of information while doing OLAP analysis. Perhaps the decision maker wants to look at the effects of certain "what if" scenarios. "What would the impact on profits be if commissions were raised by I percent?" In another situation, the decision maker may want to adjust projections or modify quotas based on OLAP information. Rather than having to open a second application to make these adjustments, and then wait for them to propagate through to the data mart, it would be easier to make the changes or write back to the OLAP data.
In most cases, however, OLAP data is read-only. Even if our OLAP system does support cube writeback, we are writing to the data mart. Our changes will not be reflected in the OLTP data.
EAN: 2147483647
Pages: 112