Reports Within Reports
Thus far, we have placed report items within report items, and data regions within data regions. In this section, we will look at putting whole reports inside one another. This is done using the subreport report item; the only item in the Toolbox that we have not yet used.
The subreport item is simply a placeholder in a report. It sits in the parent report and shows the space that will be occupied by another report when the parent report is run. There is nothing special about a report that is placed in a subreport item. Any report can be used as a subreport.
The report placed in the subreport can even contain parameters. These parameter values can be passed from the parent report to the subreport. Any field value, parameter value, or expression in the parent report can be used as a parameter in the subreport.
Subreports are used for many reasons. They can provide an easy way to reuse a complex report layout within a parent report. They can also be used to implement a more complex form of drilldown.
The following subreports are anything but subpar!
The Employee Evaluation Report
Features Highlighted
-
Using a subreport as reusable code
-
Using the page width and page height properties for a landscape report
-
Using a rectangle for grouping
Business Need The Galactic Delivery Services personnel department has created an application for employees to conduct peer reviews as a part of each employee’s annual review process. They are also collecting a review and comments from each employee’s manager. They need a report that can be used to present the results of the peer review at the employee’s meeting with their supervisor.
The manager’s review and comments should be noted as coming from the manager. The peer reviews, however, should be presented anonymously.
Task Overview
-
Create a New Report, Create a Dataset, Add a Table to the Report Layout, and Populate It
-
Create a New Report, Create a Dataset, and Populate the Report Layout
-
Add a Rectangle
Employee Evaluation Report, Task 1: Create a New Report, Create a Dataset, Add a Table to the Report Layout, and Populate It
-
Reopen the Chapter08 project if it has been closed.
-
Create a new report called EvalDetail. Do not use the GDSReport template.
-
Create a new dataset called EvalRatings that calls the stp_EvalRatings stored procedure.
-
Select the Layout tab.
-
Place a table onto the body of the report.
-
Place the Goal, Rating, and GoalComment fields in the details row of the table.
-
Add a group to the table using EvaluatorEmployeeNumber as the grouping expression.
-
Complete your report layout so it is similar to Figure 8-13. The top row has the BorderStyle: Top property set to Solid. The bottom row has the BorderStyle: Top property set to Solid and the BorderWidth: Bottom property set to 5pt.
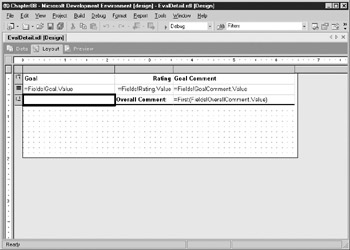
Figure 8-13: The Employee Evaluation Detail Report layout
Task Notes The EvalDetail report will be used in two subreports in our parent report. It will be used in one location to display the peer reviews and in another location to display the manager review. We can create this layout for displaying review information and then use it in multiple places.
Employee Evaluation Report, Task 2: Create a New Report, Create a Dataset, and Populate the Report Layout
-
Create a new report called EmployeeEval using the GDSReport template.
-
Create a new dataset called EvalPerformance that calls the stp_EvalPerformance stored procedure.
-
Select the Layout tab.
-
Modify the following properties of the report:
Property
Value
PageSize: Width
11in
PageSize: Height
8.5in
This will create a landscape page layout rather than a portrait page layout.
-
Drag the right edge of the report body until it is 10 inches wide. Use the ruler at the top of the layout area as a guide.
-
Drag the EmployeeName field onto the report body. Modify the following properties of the text box that results:
Property
Value
Font: FontSize
20pt
Font: FontWeight
Bold
Location: Left
0in
Location: Top
0in
Size: Width
6.875in
Size: Height
0.5in
-
Place a text box onto the report body. Modify the following properties of this text box:
Property
Value
Font: FontSize
20pt
Font: FontWeight
Bold
Location: Left
8.25in
Location: Top
0in
Size: Width
1.625in
Size: Height
0.5in
Value
=Parameters!Year.Value
-
Place a text box onto the report body. Modify the following properties of this text box:
Property
Value
Font: FontSize
16pt
Font: FontWeight
Bold
Location: Left
0in
Location: Top
0.625in
Size: Width
2in
Size: Height
0.375in
Value
Peer Evaluations
-
Place a subreport onto the report body immediately below the text box. Modify the following properties of this subreport:
Property
Value
Location: Left
0in
Location: Top
1in
Size: Width
6.875in
Size: Height
1.125in
-
Right-click the subreport and select Properties from the context menu. The Subreport Properties dialog box will appear.
-
Select EvalDetail from the Subreport drop-down list.
-
Select the Parameters tab.
-
Configure the parameters as shown here:
Parameter Name
Parameter Value
EmpNum
=Parameter!EmpNum.Value
Year
=Parameter!Year.Value
MgrFlag
=0
Remember to use the Edit Expression dialog box to select the parameter values.
-
Click OK to exit the Subreport Properties dialog box.
-
Select the Peer Evaluations text box and the subreport. Press CTRL-C to copy these two items. Press CTRL-V to paste a copy of these items on the report body. Drag the two copied items so that they are immediately below the original subreport.
-
Modify the new text box to read “Manager Evaluation.” Adjust the width of the text box as needed.
-
Open the Subreport Properties dialog box for the new subreport and select the Parameters tab.
-
Change the parameter value for MgrFlag from “=0” to “=1”. This will cause the second subreport to contain the manager’s evaluation rather than the peer evaluations.
-
Click OK to exit the Subreport Properties dialog box.
-
Place a text box onto the report body. Modify the following properties of this text box:
Property
Value
Font: FontWeight
Bold
Location: Left
7.125in
Location: Top
1in
Size: Width
2in
Size: Height
0.25in
Value
Areas of Excellence
-
Drag the AreasOfExcellence field onto the report body. Modify the following properties of the text box that results:
Property
Value
Location: Left
7.125in
Location: Top
1.375in
Size: Width
2.75in
Size: Height
0.25in
-
Place a text box onto the report body. Modify the following properties of this text box:
Property
Value
Font: FontWeight
Bold
Location: Left
7.125in
Location: Top
1.875in
Size: Width
2in
Size: Height
0.25in
Value
Areas for Improvement
-
Drag the AreasForImprovement field onto the report body. Modify the following properties of the text box that results:
Property
Value
Location: Left
7.125in
Location: Top
2.25in
Size: Width
2.75in
Size: Height
0.25in
-
Select the Preview tab. Enter 1394 for EmpNum and 2003 for Year and then click View Report. Your report should appear similar to Figure 8-14.
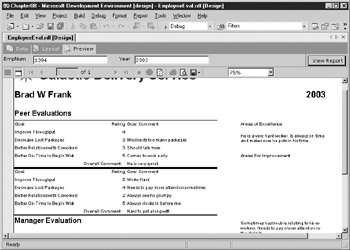
Figure 8-14: The Employee Evaluation Report preview after Task 2
Task Notes Two steps are required to get each subreport item ready to use. First, we have to specify which report is going to be used within the subreport. Once this is done, we need to specify a value for each of the parameters in the selected report. With these two tasks completed, our subreports are ready to go.
In this report, we are using several fields outside of a data region: the EmployeeName field, the AreasOfExcellence field, and the AreasForImprovement field. Remember, data regions are set up to repeat a portion of their content for each record in the result set. When a field value occurs outside of a data region, it is not repeated, but occurs only once. Therefore, the field value must be put inside of an aggregate function to determine how to get one value from the many records in the result set. The First() aggregate function is chosen by default.
In this particular report, the EvalPerformance dataset has only one record. Of course, Visual Studio does not know at design time how many records the dataset will have at run time. (Even if the dataset has only one record at design time, it could have 100 at run time.) Therefore, Visual Studio insists on the aggregate functions for this field value.
Finally, you may have noticed a little problem with the text box that contains the contents of the AreasForImprovement field. It seems to be sliding down the page. In actuality, it was pushed down the page when the subreport grew.
The text boxes that contain the Areas of Excellence title, the AreasOfExcellence field value, and the Areas for Improvement title are all even with the first subreport. However, the text box containing the value of the AreasForImprovement field starts below the bottom of the first subreport. When the subreport grows due to its contents, the text box is pushed further down the report so that it remains below the bottom of the subreport.
In Task 3, we will look at a way to prevent this problem.
Employee Evaluation Report, Task 3: Add a Rectangle
-
Select the Layout tab.
-
Select the Areas of Excellence text box, the AreasOfExcellence field value text box, the Areas for Improvement text box, and the AreasForImprovement field value text box. Press CTRL-X to cut these four text boxes.
-
Select a rectangle from the Toolbox and place it in the area just vacated by these four text boxes.
-
With the rectangle still selected, press CTRL-V to paste the four text boxes into the rectangle.
-
Arrange the rectangle and the four text boxes as needed. Your layout should appear similar to Figure 8-15.
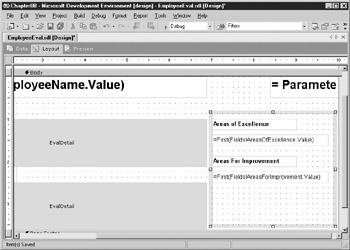
Figure 8-15: The Employee Evaluation Report layout with a rectangle -
Select the Preview tab. Enter 1394 for EmpNum and 2003 for Year and then click View Report. Your report should appear similar to Figure 8-16.
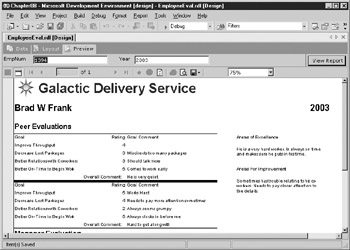
Figure 8-16: The Employee Evaluation Report preview with a rectangle -
Select Save All from the toolbar.
Task Notes The rectangle report item comes to our rescue here. Once the four text boxes are inside the rectangle, they remain together no matter how much the subreport grows. As your report designs become more complex, rectangles will often be necessary to keep things right where you want them.
The Invoice Report
Features Highlighted
-
Using a subreport in a table
-
Using a subreport to facilitate drilldown
Business Need The Galactic Delivery Services accounting department would like an interactive Invoice Report. The Invoice Report will show the invoice header and invoice detail information. The user will then be able to expand an invoice detail entry to view information on the delivery that created that invoice detail.
Task Overview
-
Create a New Report, Create a Dataset, and Copy the Layout from the DeliveryStatus Report
-
Create a New Report, Create a Dataset, and Populate the Report Layout
Invoice Report, Task 1: Create a New Report, Create a Dataset, and Copy the Layout from the DeliveryStatus Report
-
Reopen the Chapter08 project if it has been closed.
-
Create a new report called DeliveryDetail. Do not use the GDSReport template.
-
Create a new dataset called DeliveryStatus that calls the stp_DeliveryDetail stored procedure.
-
Select the Layout tab.
-
Double-click the entry for the DeliveryStatus report in the Solution Explorer to open the DeliveryStatus report.
-
Select the table in the DeliveryStatus report and press CTRL-C to copy it. (Make sure you have the entire table selected, not just a single cell in the table.)
-
Close the DeliveryStatus report and return to the DeliveryDetail report.
-
Press CTRL-V to paste the table into the report body.
-
Move the table to the upper-left corner of the report body. Size the report body so that it exactly contains the table.
Task Notes Instead of re-creating a layout for the delivery detail, we borrowed a layout we created previously in another report. This works because the stp_DeliveryDetail stored procedure returns the same columns as the stp_DeliveryStatus stored procedure used for the previous report. The other requirement needed to make this cut-and-paste operation successful was to use the same name for the dataset in both reports.
When you have a layout that is nice and clean, it is always a good idea to reuse it whenever possible. It would be even better to modify the DeliveryStatus report to use our new DeliveryDetail report in a subreport. That way, we would only need to maintain this layout in one location.
Consider that an extra credit project.
Invoice Report, Task 2: Create a New Report, Create a Dataset, and Populate the Report Layout
-
Create a new report called Invoice using the GDSReport template.
-
Create a new dataset called InvoiceHeader that calls the stp_InvoiceHeader stored procedure.
-
Create a second dataset called InvoiceDetail that calls the stp_InvoiceDetail stored procedure.
-
Select the Layout tab.
-
Place a list onto the report body.
-
Size the list and add fields and text boxes to create the layout shown in Figure 8-17.
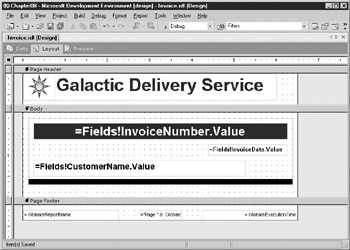
Figure 8-17: The Invoice Report layout with an invoice header -
Drag the report body to make it larger.
-
Place a table onto the report body immediately below the list.
-
Select InvoiceDetail from the drop-down list at the top of the Fields window.
-
Drag the LineNumber, Description, and Amount fields into the details row of the table.
-
Size the table columns appropriately. Type a “C” for the Format property of the text box containing the Amount field value.
-
Turn off the table header and table footer.
-
Add a second details row below the existing details row.
-
Merge the three cells in this new details row.
-
Place a subreport in the merged cell.
-
Open the Subreport Properties dialog box. Set the subreport to DeliveryDetail.
-
Select the Parameters tab and configure it as follows:
Parameter Name
Parameter Value
DeliveryNumber
=Fields!DeliveryNumber.Value
-
Click OK to exit the Subreport Parameters dialog box.
-
Click the gray box to the left of the row containing the subreport. Modify the following properties for this table row:
Property
Value
Visibility: Hidden
True
Visibility: ToggleItem
LineNumber
-
Select the Preview tab. Type 73054 for InvoiceNumber and click View Report.
-
Expand one of the invoice detail entries and observe how the subreport appears.
-
You can widen the report body, list, and table so that the report layout does not expand when the subreport appears. Your report should appear as shown in Figure 8-18.
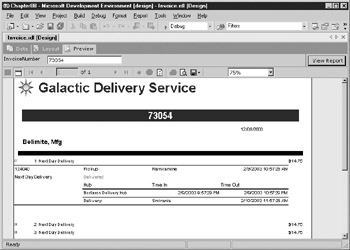
Figure 8-18: The Invoice Report preview -
Select Save All from the toolbar.
Task Notes In the Invoice Report, we placed our subreport right in a table cell. A field from the table’s dataset is used as the parameter for the subreport. Because of this, the subreport is different for each details row in the table.
We chose to have the subreport initially hidden in our report. The reason for this is that the subreport contains a large amount of detail information. This detail would overwhelm the users if it were displayed all at once. Instead, the users can selectively drill down to the detail they need.
In our next report, we will look at another way to manage large amounts of detail by using the drill-through feature of Reporting Services.
EAN: 2147483647
Pages: 109