Chapter 7: Geometric Proximity Graphs
| | ||
| | ||
| | ||
Overview
In Chapter 6, we studied a data structure that provides a notion of proximity among its sites, without explicitly saying so, namely Delaunay diagrams. In this chapter, we will learn about other graphs that are defined based on the notion of proximity (with different concrete meaning).
Interest in geometric proximity graphs (sometimes also referred to as neighborhood graphs ) has been at a high level for about 20 years , in many diverse areas such as computational geometry, theoretical computer science, and graph theory. In a sense, polygonal meshes, which are an extremely common boundary representation of graphical objects, are a special kind of proximity graph.
These graphs can serve as a powerful tool to capture the structure or shape of otherwise unstructured point sets. Therefore, they have numerous applications in areas such as computer graphics, computer vision, geography, information retrieval, routing in ad-hoc networks, and computational biology, among many others (see Figure 7.1).
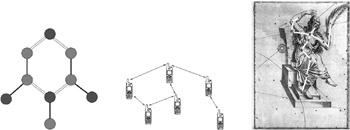
Figure 7.1: Identifying all pairs of close nodes in a set can reveal significant structure, such as a molecule or a mobile ad-hoc network. However, care must be exercised when establishing that proximity is indeed relevant (Cassiopeia courtesy of [RAS]).
Even in psychology, they can help to explain some optical illusions [Sattar 04]. For instance, the well-known Mueller-Lyer illusion [Coren and Girgus 78] consists of two arrows, one with inward pointing arrowheads and the other with out-ward pointing arrowheads (see Figure 7.2).
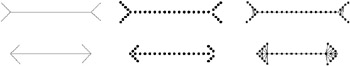
Figure 7.2: Proximity graphs can even help in psychology to explain some optical illusions.
In this chapter, we will present a small number of neighborhood graphs (other than polygonal meshes) and a few applications in computer graphics, where they can help to detect structure in point clouds.
EAN: N/A
Pages: 69