Eclipse
|
| < Day Day Up > |
|
In this section, we show you how to prepare the Eclipse IDE for debugging a Struts application. Once we have Eclipse configured, we move on to actually debugging a Struts application.
Installing the Tomcat Plugin
First, let's cover the installation process required when you're using the Sysdeo Tomcat Plugin:
-
Download Eclipse 2.1.1 from http://www.eclipse.org/downloads/index.php.
-
Extract Eclipse to a convenient location. I am using c:\eclipse for this example.
-
Download the Struts 1.1 source (in a zip format) from http://www.apache.org/dist/jakarta/struts/source/.
-
Place the Struts zip file into another convenient location. This example uses c:\StrutsSrc.

You do not need to unzip this file. Eclipse will read the source files in the compressed zip format.
-
Download and extract the Sysdeo Tomcat Plugin version 2.1.1 from http://www.sysdeo.com/eclipse/tomcatPlugin.html to the <ECLIPSE_HOME>/plugins directory.
There are other Tomcat Plugins, but at the time of this writing the Sysdeo one is the most complete.
-
Start the Eclipse application. You should see a screen similar to the one shown in Figure 7.1.
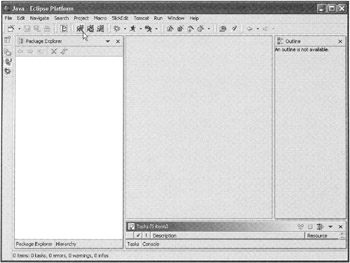
Figure 7.1: The Eclipse IDE.As you look over Figure 7.1, notice that I have an extra menu: SlickEdit. This is a convenient tool (officially know as the Visual SlickEdit Plugin for WebSphere Studio & Eclipse) that I use to emulate a VI editor. This Plugin is something that I cannot get by without—it has nothing to do with debugging Struts applications.
-
You should now see a new toolbar that has three buttons on it. These buttons are used to start, stop, and restart Tomcat, respectively. If you do not see these buttons, select the Window > Customize Perspectives command, and in the resulting dialog box, choose Other Node and select the Tomcat checkbox. Your screen should resemble the one shown in Figure 7.2.
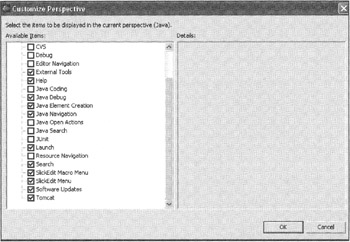
Figure 7.2: The Customize Perspectives dialog box. -
Now you need to tell the Sysdeo Plugin the location of your Tomcat installation. You do this by first opening the Eclipse Preferences dialog box, shown in Figure 7.3.
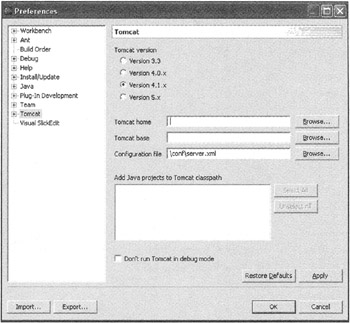
Figure 7.3: The Eclipse Preferences dialog box. -
Go ahead and select Tomcat Version 4.1.x, enter the location of your Tomcat installation, and click the Apply button. Your settings should look like the ones shown in Figure 7.4.
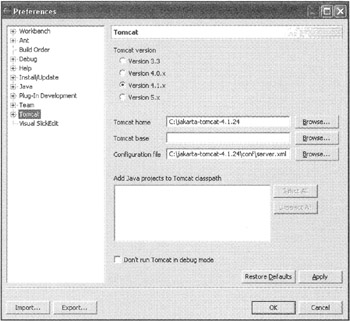
Figure 7.4: Tomcat settings. -
The final step is configuring your Java Virtual Machine (JVM). You do this by going back to the Preferences menu.
-
Expand Java > Installed JREs and either make sure that you have an installed Java Runtime Environment (JRE) or browse to your installed JRE. Figure 7.5 shows a list of installed JREs.
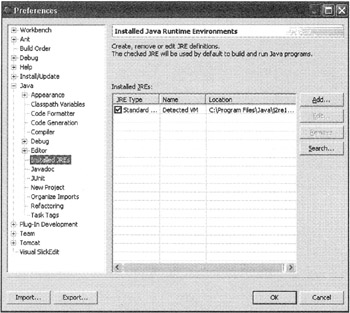
Figure 7.5: A list of installed JREs.When using Sysdeo's Tomcat Plugin, have version 1.4x of the Java Development Kit (JDK) installed.
Debugging Your Struts Application with Eclipse
Now let's begin debugging our wroxapp Web application, using our recently installed Sysdeo Plugin.
Complete the following steps:
-
Start the Eclipse application.
-
Select File > New Project. You should see a dialog box similar to the one shown in Figure 7.6.
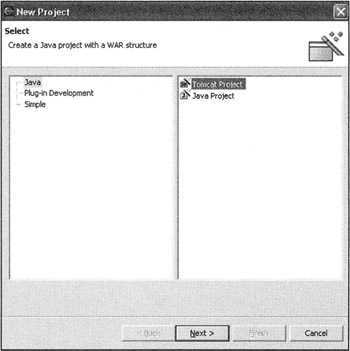
Figure 7.6: The New Project dialog box. -
Click the Next button. In the New Tomcat Project dialog box, enter the value wroxapp as the name of the project, deselect the Use Default checkbox, browse to the directory containing the most recent version of the wroxapp Web application, and select the wroxapp directory. Your dialog box should now look like the one shown in Figure 7.7.
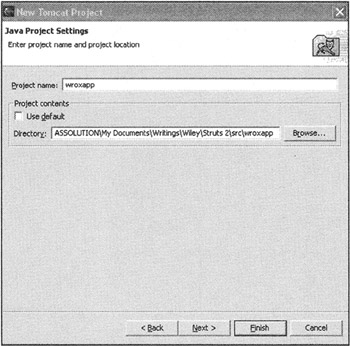
Figure 7.7: Our Java project settings. -
Now click the Next button, and you will be prompted to enter the Tomcat project settings. The settings on this screen should match the ones shown in Figure 7.8; if not, make the appropriate changes and then click the Finish button.
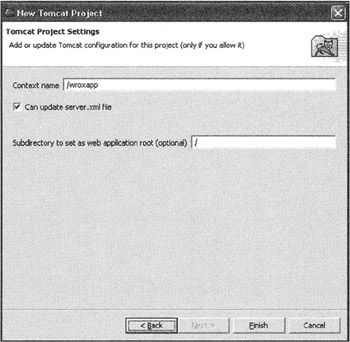
Figure 7.8: The Tomcat project settings. -
You should now see the main Eclipse window with the wroxapp project, including its associated subcomponents, in the Package Explorer. Figure 7.9 shows the results of our efforts.
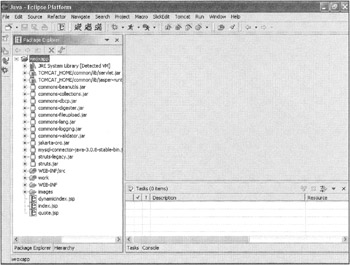
Figure 7.9: The main Eclipse window with the wroxapp project. -
This next step seems to be a bit of a kludge and is necessary only if you have completed the examples from Chapter 9, "Internationalizing Your Struts Applications." (If you have not completed the examples in that chapter, you can skip ahead to Step 10.) As you may recall, we created two resource bundles containing Locale-dependent strings that we placed in the WEB-INF/classes directory. Eclipse does not by default treat the WEB-INF/classes directory as a source directory and therefore will remove any extraneous files prior to rebuilding the application. To change this behavior, complete the following three steps.
-
Select Project > Properties, expand the Java Build Path Node, and select the Source tab. You should see a dialog box similar to that shown in Figure 7.10.
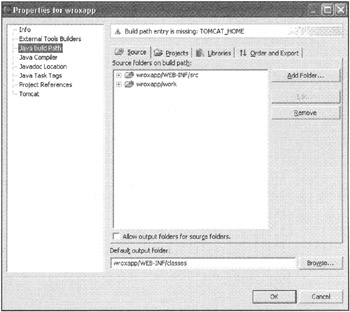
Figure 7.10: The Project Properties dialog box. -
Now click the Add Folder button, expand the wroxapp node until you see the classes directory, and then select that directory, as shown in Figure 7.11.
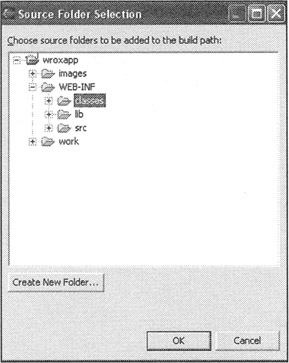
Figure 7.11: The Source Folder Selection dialog box. -
Click OK. You should now see the WEB-INF/classes directory listed in the Source Folders Build Path, as shown in Figure 7.12.
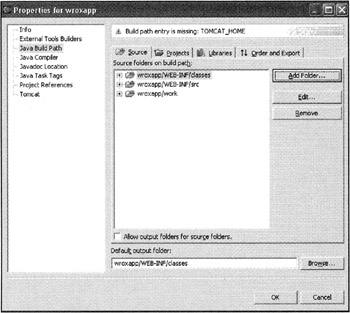
Figure 7.12: The Source Folders Build Path. -
Now you need to rebuild the entire application. You can do this by selecting Project > Rebuild All.
At this point, you have everything you need to debug your Struts application—which is the focus of our next section.
Stepping Through Your Source
Now that you have everything configured to debug your application, let's get started. This is the easy part—there are only a few places that you will want to set breakpoints.
The first of these places is in the source of your ActionForm object. For this example, let's look at the ch03.LookupForm. To set a breakpoint in this ActionForm implementation, open the source file by double-clicking on it in the Package Explorer. Locate it in the WEB-INF/src/ch03/ directory. Once you have this file open, scroll down to the validate() method and double-click on the left side of the editor pane on the line containing the following snippet:
ActionErrors errors = new ActionErrors();
This sets a breakpoint on this line, which tells Eclipse that it should stop on this line whenever it encounters this piece of code while debugging. If you follow these steps correctly, your editor pane should have a breakpoint marker similar to the one in Figure 7.13.
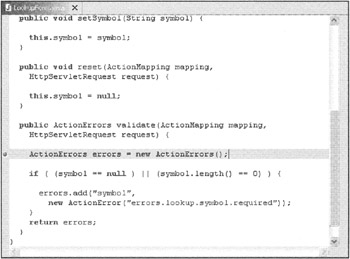
Figure 7.13: A source breakpoint.
The next place that you want to test is the Action implementation, so find the ch03.LookupAction and open the source file by double-clicking on it in the Package Explorer. Locate it in the WEB-INF/src/ch03/ directory, and once you have the file open, scroll down to the execute() method. Doubleclick on the left side of the editor pane on the line containing this code snippet:
String target = new String("success"); Okay, now it is time to test your breakpoints. To begin this process, click the Start Tomcat button on the main toolbar. As the Tomcat Plugin starts, it prints quite a bit of information to the Eclipse console. The application is not ready for debugging until you see output similar to that shown in Figure 7.14. The line you are looking for is the Jk running line.

Figure 7.14: Starting the Tomcat Plugin.
You should also see a debug window. This window allows you to step through the actual application. It features a toolbar with nine buttons that you can use to perform various debug operations (only the appropriate buttons are enabled). Figure 7.15 shows the debug window for this application.
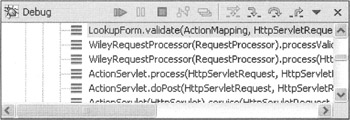
Figure 7.15: The Eclipse debug window.
Once this output is printed and you can see the active debug window, you can begin the debugging process. To get this process under way, open a browser to the following URL:
-
http://localhost:8080/wroxapp/index.jsp
Now enter the value SUNW into the text box and click the Submit button. This activates the Eclipse debugger and runs the wroxapp, until it reaches its first breakpoint in the LookupForm. To step through your source, select one of the buttons from the Debug toolbar—at this point, I recommend using the Step Over button.
As you are stepping through each line of code, keep an eye on the Variables window—you will see the values in this window change as your variables are manipulated. You can also expand this node when you want to view the data members local to the object you are currently debugging. Figure 7.16 shows the Variables window.
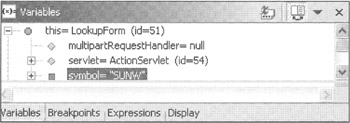
Figure 7.16: The Eclipse Variables window.
When you have stepped past the last line in the validate() method, the source code window displays a message stating that it cannot find the source for the RequestProcessor, as shown in Figure 7.17.
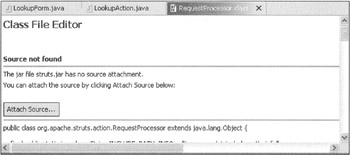
Figure 7.17: The missing source code message.
This message appears when you have not told the debugger about the Struts source code. We do this in the following section, but before we move on, go ahead and click the Resume button on the Debug menu. This resumes the current process, which continues until it reaches the next breakpoint (in this case, in the LookupAction.execute() method). This breakpoint allows you to step through your execute() method and monitor the processing of both the data passed to your Action and the logic encased in this Action.
As I am sure you are aware, there are many other places that can be debugged in a Struts application. The goal of this section was not to identify every debuggable entry point, but rather to give you a look at some of the more common places you can add breakpoints.
Stepping Through the Struts Source
In this section, we go one step further in our debugging efforts: we actually step through the Struts source. This exercise should give you a good handle on how Struts processes its requests.
To begin, make sure that you retrieved the Struts source (as described in Step 3 of the "Installing the Tomcat Plugin" section of this chapter). Also verify that you have version 1.1 of both the Struts source and JAR files. Once you have verified this, complete these steps:
-
Stop the Tomcat Plugin by selecting the Stop Tomcat button.
-
Select the struts.jar node from the Package Explorer (as shown in Figure 7.18).
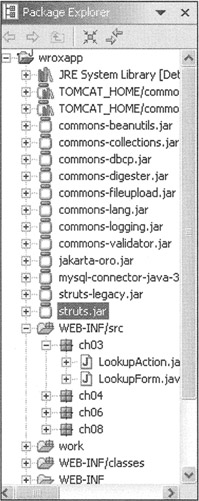
Figure 7.18: Selecting the struts.jar node from the Package Explorer. -
Right-click on the struts.jar node and select Properties.
-
Select the Java Source Attachment node.
-
Click the External File button and browse to the location of your jakarta-struts-1.1-src.zip file. At this point, the Properties dialog box should look like the one in Figure 17.9.
-
Now click the OK button.
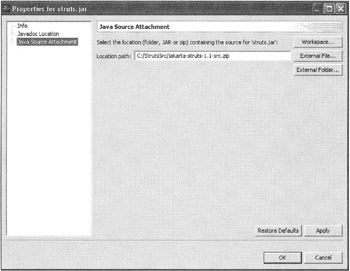
Figure 7.19: The Properties dialog box.
You are ready to step through the Struts source. Again, there are several places that you can set a breakpoint, but one of the best places to begin your debugging of a Struts application is in the ActionServlet—this is where everything begins in a Struts application. And the best place to begin within the ActionServlet is the process() method. If you remember from our previous discussions, the process() method is the first method called by the ActionServlet's doPost() and doGet() methods and is the entry point to all Struts requests.
To set a breakpoint in the process() method, complete the following steps:
-
Expand the struts.jar node (found in the Package Explorer).
-
Expand the org.apache.struts.action node.
-
Expand the ActionServlet node.
-
Scroll down until you find the process() method and double-click on it.
-
Find the following line and set a breakpoint:
RequestUtils.selectModule(request, getServletContext());
That's all there is to it. Now restart Tomcat and open your browser to the following wroxapp/index.jsp:
-
http://localhost:8080/wroxapp/index.jsp
Go ahead and enter SUNW again and click the Submit button. When Tomcat receives the request, it sends the request on to the ActionServlet, and its doPost() method calls the process() method—which is where you set your breakpoint. Now you can simply step through the application as if it was any other application.
When you are debugging the process() method, you must click the Step Into button if you want to follow the entire processing of the request.
|
| < Day Day Up > |
|
EAN: 2147483647
Pages: 183