Assessing Current Resources
Once you have determined the needs of your users, the next step in planning your organization is to assess your current resources. To make this assessment, you must put together three diagrams: one of your company’s geographic profiles, another of your network topology, and a third of your Active Directory networking model.
Defining Your Geographic Profile
The easiest place to start your assessment is with a geographic profile of your company. Get out a pen and paper, and start drawing maps. If your network is global, start with all the countries in which your company has offices. Work your way down through states, cities, buildings, and even in-building locations.
Defining Your Software Environment
After you have a firm idea of how your company is laid out geographically, gather information on where users and resources are located within those geographical regions. This information helps you determine where the users are, where the computers are, whether the computers are ready for Exchange Server 2003 or your chosen messaging client, and how many licenses you are going to need. Consider the following along the way:
-
Where are existing servers located?
-
What are the servers’ names and roles?
-
What versions of which software are installed on the servers?
-
How many workstations are in each location?
-
What operating systems and software are used on those workstations?
-
How many users are in each location?
-
What are the users’ needs?
Defining Your Network Topology
After you’ve created diagrams of your company’s geographic profile, you need to diagram your company’s network. Unlike the geographic profile, a network topology tells you exactly how your network is put together physically. When reviewing the geographic topology of the network, be sure to mark out the wide area network (WAN) links between the various locations and their bandwidths. This step helps you assess the network boundaries, the connectors required between locations, and the replication schedules. Figure 5-1 shows an example of a network diagram for a companywide WAN.
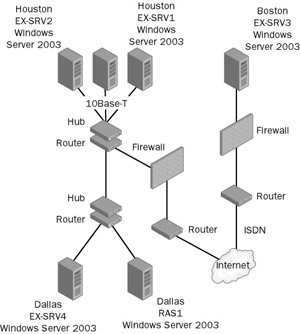
Figure 5-1: Diagramming your network topology.
Ideally, you will already have a detailed inventory of your existing network assets. A comprehensive inventory includes a list of all the hardware and software on all of the computers on your network. The inventory should also take into account how your network is constructed and maybe even some of the network’s use statistics.
If you don’t already have a network inventory, you could go to all the computers on your network with a notebook in hand, but a better method is to use an automatic inventory system such as that built into Windows Server 2003 or, for larger networks, Microsoft Systems Management Server (SMS). You can use Windows and SMS to gather hardware and software information automatically from computers on your network. You can also use SMS to push installations of software (such as messaging clients) to workstations throughout the network from a central location, to control and support client software remotely, and even to keep track of licensing information on your network. SMS really is must-have software for any up-and-coming Exchange administrator.
Note, however, that SMS is not a simple install-and-run application. It is a comprehensive, enterprise-capable network management software package. SMS requires Microsoft SQL Server to provide the underlying database that captures and manages the network’s data. To implement SMS and SQL Server, you should have defined and executed a project plan and systems design.
For more details on the systems management capabilities built into Windows Server 2003, see your product documentation. For more information on using Systems Management Server, check out the Microsoft Systems Management Server 2003 Administrator’s Companion by Steven D. Kaczmarek (Microsoft Press).
A clear definition of your network’s topology allows you to plan site boundaries, site connections, and server placement and to understand replication issues. Whether your network is a single local area network (LAN) within one office building or a WAN connecting thousands of users around the world, you should design the Exchange organization to optimize its messaging functions over the network topology.
Areas that can be optimized include the following:
-
Routing group definition
-
Server placement
-
Message routing
-
Public folder replication
The first step in defining a network topology is to determine the size of your network. The size of your network dictates how you will make many planning decisions. On a large WAN, for example, especially one that is geographically dispersed, you might want to consider setting up multiple routing groups. Using multiple routing groups means that you have to consider such things as messaging connectors, directory replication, and public folder replication among sites. If you are setting up a relatively small LAN, you might decide to configure only one routing group in your organization, which makes many of these decisions much easier.
In a small company, all your computers are likely to be connected on one high- speed LAN. In larger companies, networks usually consist of many small LANs connected in various ways to form larger, interconnected LANs or WANs. In your network topology diagram, you need to include all segments that make up your network. Figure 5-2 shows an example of a simple network diagram for a LAN.
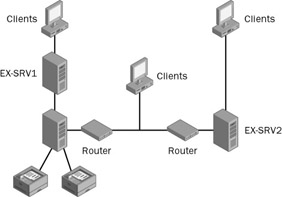
Figure 5-2: Diagramming a LAN.
For each segment, ask yourself the following questions:
-
How big is the segment? How many computers are there? How large a geographic area does the segment cover?
-
How is the segment wired? Does it use thin or thick Ethernet, shared or switched Ethernet, 10 Mbps or 100 Mbps, Fiber Distributed Data Interface (FDDI), token ring, or something else?
-
What is the bandwidth of the segment? Determine the optimal bandwidth according to the type of network being used.
-
How is the segment connected to other segments? Is the network segment connected to the rest of the network directly; is it connected through a router, switch, or bridge; or is it connected through a WAN link? Is the connection permanent or switched? What is the bandwidth of the connection?
-
What protocols are used on the network?
-
What are the traffic patterns on the network segment? At what times of day is network traffic within the segment heaviest? What application and operating system functions account for this traffic?
-
What are the traffic patterns between this segment and other segments? At what times of day is network traffic heaviest between segments? What application and operating system functions account for this traffic?
| Tip | Although doing so can be somewhat tricky, you need to determine the available bandwidth of each segment of your network. The available bandwidth is the amount of bandwidth not consumed by average network activity. For example, if the throughput of a WAN link is 1.544 Mbps and the bandwidth consumed on that link can peak at 1.544 Mbps but averages around 512 Kbps (equivalent to 0.5 Mbps), the available bandwidth will be 1.544 Mbps through 0.5 Mbps, or 1.044 Mbps. You subtract the average value, not the peak value, because all network links experience peaks that don’t represent the usual network bandwidth consumption. |
Defining Your Active Directory Model
The final step in assessing your current resources is to document the Active Directory model in use on the network. Again, constructing a diagram is helpful. Whereas the topology diagram illustrates the physical layout of your network (cables, routers, and so on), the diagram of the networking model will illustrate the logical layout of your network. This logical layout includes how many domains your network has, how those domains are configured to interact, and the functions of those domains and the servers in them. Figure 5-3 shows a basic example of an Active Directory model.
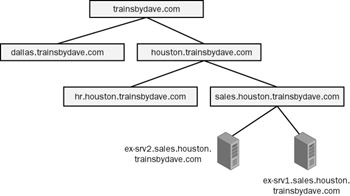
Figure 5-3: Diagramming a networking model.
Although Exchange Server routing and administrative groups differ from the sites and domains used in Active Directory, Exchange Server resources rely on domains and domain controllers to perform essential security operations. For example, to access an Exchange mailbox, a user must log in to a domain using a valid user account. Because Exchange Server services are Windows services, they too need to be authenticated by a domain controller before they can perform their functions. Each server in an Exchange organization is configured with a special user account called the Site Services account, which is used to validate Exchange services. For a detailed look at the integration of Exchange Server 2003 and Active Directory, see Chapter 4, “Understanding Windows Server 2003 Integration.”
If your network contains only a single domain, the task of diagramming the networking model is easy. If your network consists of multiple domains, for each domain on your network, ask the following questions:
-
What is the name of the domain?
-
What is the function of the domain?
-
Are any special trusts (i.e., cross-link trusts or one-way trusts) configured?
-
How many user accounts are configured in this domain?
-
What resources are configured in this domain?
-
Who are the administrators of this domain?
-
In what domain are the user accounts of the administrators configured?
Putting the Diagrams Together
After you’ve diagrammed your networking model, it’s helpful to see how the networking model diagram, the geographic diagram, and the network topology diagram fit together. No real rule defines how Exchange routing or administrative groups should correspond to Active Directory domains. It is tempting, and sometimes appropriate, simply to create a routing and administrative group for each domain. However, this approach does not always work. A single domain might cover several geographic regions that a routing group might not be able to span, due to the topology of your network. You could end up with one group spanning several domains, or you cold end up with one domain spanning several groups. These decisions are more an art than science—an art that is the topic of the next chapter.
EAN: 2147483647
Pages: 254