Formatting Tables

If an evenly spaced table is all you need, you've learned all you need to know in order to create one. However, most of the time you need to have some control over the width of columns or the height of rows, as well as over lines, borders, and other formatting features. The following sections describe how to change these aspects of tables.

Understanding the Structure of Tables

Before you begin exploring table formatting, it helps to have a basic understanding of how tables are structured:

  • A table consists of at least one row and one column. For convenience, people refer to columns by letter (Column A, Column B, and so on), and to rows by number (Row 1, Row 2, and so on).

  • The intersection of a row and column is called a cell. For convenience, people use the column and row to name a cell (for example, Cell A1, Cell B5).

  • By default, cells are separated by single visible lines. With lines or without, a table's structure still separates the columns and rows.

  • By default, a table has no border, but the outside lines of the outside cells make it appear that there is one.

  • By default, text is aligned at the top left of a cell.

As you begin modifying a table, you need to keep in mind what you're changing. In no time at all, the whole concept of table structure will seem natural to you.

Using the Tables and Borders Toolbar

When you first create a table, PowerPoint displays a floating Tables and Borders toolbar (refer to Figure 8.7). Sometimes it's easy to modify a table simply by using the mouse or menus. Other times, the Tables and Borders toolbar can be quite handy.

graphics/tables_and_borders.gif If the Tables and Borders toolbar is not visible, simply click the Tables and Borders button on the main toolbar. If that button is already highlighted, look around, and you might find the toolbar docked somewhere or in another toolbar. If that is the case, simply drag the dotted left end of the Tables and Borders toolbar out into the slide editing area of the screen (refer to Figure 8.7).

You use the top row of buttons on the Tables and Borders toolbar when drawing a custom table. You generally use the bottom row when modifying an existing table. Instead of explaining the toolbar here in detail, the next several sections point out the toolbar buttons that accomplish the tasks being discussed. If you ever have questions about what a button does, you can just hover the mouse pointer over the toolbar buttons to see what they are for or click them to see what happens. You can always use the Undo feature!

Adjusting Columns and Rows

Evenly spaced columns and rows look nice...until you begin to put data in the table cells. It soon becomes evident that some columns need more width than others. If you increase the width of a column, other columns must become smaller. Increasing the size of rows, however, simply makes the table longer. Nevertheless, too many large rows on a PowerPoint slide can also present a problem.

To change the width of a column, follow these steps:

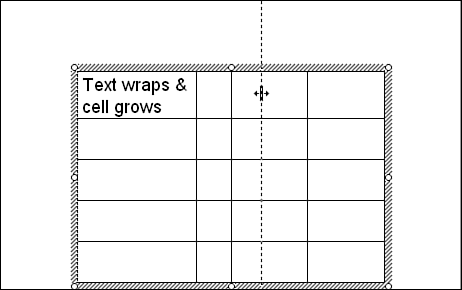
  1. Move the mouse pointer to the line that separates the two columns you're going to change. The mouse pointer turns into a double line, with arrows pointing in opposite directions. Figure 8.8 shows column lines being changed.

    Figure 8.8. You can drag column or row lines to adjust width or height.

    graphics/08fig08.gif

  2. Click and drag the line right or left.

  3. Release the mouse button to relocate the column line.

  4. Repeat these steps until the columns are spaced appropriately for the data they contain.

You can also adjust the height of table rows. To do so, simply follow these steps, but instead of dragging column lines, drag row lines up or down. Note, however, that you can't decrease the height of a row to anything smaller than the height of a single line of text.

graphics/distribute_rows.gif graphics/distribute_columns.gif There are some aids that can help you measure column widths or row heights (for example, the ruler or grid lines) or to space selected columns or rows evenly (the Distribute Rows/Columns Evenly buttons on the Tables and Borders toolbar). However, although precise table measurements might be important in a Word document, PowerPoint tables are going to be viewed from a projected computer screen. If column and row measurements look good to you onscreen, that's all that really matters.

Besides adjusting the sizes of rows and columns, you might find that you need to add a column or row, or you might need to remove one. To insert a column, follow these steps:

  1. Position the insertion point where you want to add the column.

  2. graphics/tables_and_borders.gif Click the Tables and Borders button to display the Tables and Borders toolbar, if it's not already visible.

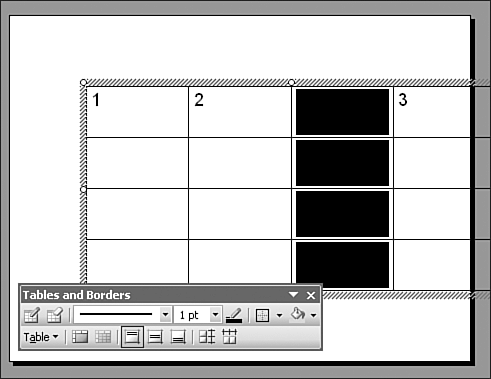
  3. On the Tables and Borders toolbar, click Table and from the drop-down menu, choose the Insert Columns option you need. Insert Columns to the Left inserts a column to the left of the current location, and Insert Columns to the Right inserts one to the right of the current location (see Figure 8.9).

    Figure 8.9. After you insert columns or rows, you might need to adjust them to fit on the PowerPoint slide.

    graphics/08fig09.gif

  4. Adjust the column widths to make the table fit within the slide's boundaries.

You follow a similar procedure to insert or delete multiple rows or columns. First, select the rows or columns you want to insert or delete. For example, if you want to insert two rows, select two rows in the current table at the location you want to insert new rows. Then from the Table button on the Tables and Borders toolbar, choose from among the available options (Insert/Delete to the Left, Right, Above, or Below).

Caution

graphics/cman.gif

When you delete a column or row, PowerPoint also deletes the contents of all the cells in that column or row, without asking if that's okay.

graphics/undo.gif If you accidentally delete a row or column, you can use Undo to get it back.


Splitting and Merging Cells

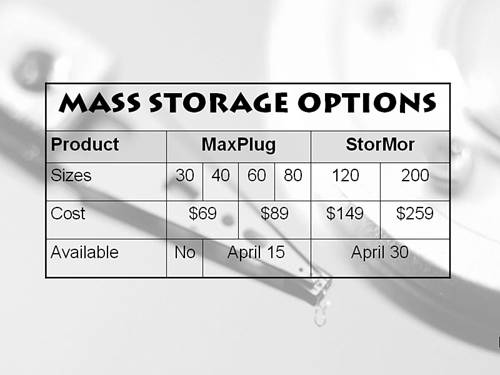
Have you ever noticed that many forms, such as invoices, are organized much like tables? Indeed, most of them look like tables, except that some rows or columns seem to have more or fewer cells. To create form-like tables in PowerPoint, you can vary the number of cells in any given row or column of a table. Consider, for example, the table shown in Figure 8.10. Some parts of the table appear to have fewer cells than they should, and others seem to have extra cells. You create this effect by merging or splitting cells.

Figure 8.10. You can create unique combinations of table cells by merging and splitting cells.

graphics/08fig10.jpg

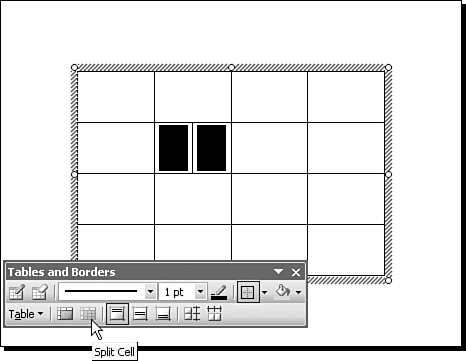
graphics/split_cell.gif To split a cell, position the insertion point in a cell and click the Split Cell button on the Tables and Borders toolbar. The cell then splits into two equal-sized cells (see Figure 8.11).

Figure 8.11. You can split a cell into two cells by using the Split Cell button.

graphics/08fig11.gif

To merge or join two or more cells, click and drag the mouse to select the cells, and then do one of the following:

  • graphics/merge_cells.gif Click the Merge Cells button on the Tables and Borders toolbar.

  • Right-click the selected cells and from the context menu choose Merge Cells.

In Figure 8.10, note that the top row of cells has been merged, and the cells in the last three rows have been split and merged.

If you try to merge cells that can't be merged, the Merge Cells button or menu appears grayed out, and you aren't able to merge the cells. Sometimes you have to merge certain cells first and then merge the resulting cell with other cells.

Modifying Borders, Lines, and Backgrounds

Tables, in and of themselves, help an audience visually organize information you present. However, you can add even more visual help by using colored lines or backgrounds.

By default, PowerPoint table cells are separated by thin single black lines. You can change the lines around a single cell, or you can select several cells, including all the cells in a table, and change several lines at once.

To modify table lines, follow these steps:

  1. Position the insertion point in the cell you want to change.

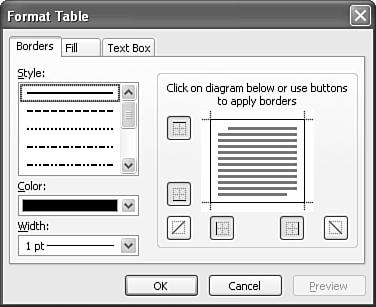
  2. graphics/table.gif Click the Table button on the Tables and Borders toolbar and choose Borders and Fill, right-click the cell and choose Borders and Fill, or choose Format, Table. PowerPoint displays the Format Table dialog box (see Figure 8.12).

    Figure 8.12. You can change table lines by using the Format Table dialog box.

    graphics/08fig12.gif

  3. Select the desired line style, line color, and line width.

  4. Click the buttons that correspond to the line locations you want to change, or simply click the sample cell diagram to change or add lines. Click a second time to turn off a line.

  5. Click OK to apply the changes and return to the slide.

graphics/undo.gif In the Format Table dialog box, you can use Preview to check out the changes before you apply them, or you can use Cancel to abort the changes. In any case, if you don't like the changes you make, you can use Undo.

You might have noticed the diagonal line options (refer to Figure 8.12). These can be useful in at least a couple ways:

  • You can use a diagonal line to divide a cell where you want two pieces of information, for example a check mark if a person is attending, and a number for the number of guests attending with the person.

  • You can use two diagonal lines to create a check mark, indicating that a cell is full, selected, or not available.

If you select multiple cells, you can also change the interior lines of the selected cells. For example, you can select all the cells in a table, make the outside lines one style and color, and make all the interior lines another style and color.

On a PowerPoint slide, table lines can sometimes stand out too much. If this seems to be the case on a slide, you can turn off a line or lines to give the appearance of merged cells while maintaining the structure of multiple cells. This technique is useful if you want to organize textual material by using a table structure but without making it look like you're using a table.

Another way to soften the effect of table lines is to use fill colors instead. For example, you could turn off lines altogether and provide shading for alternating rows.

To change cell fills, follow these steps:

  1. Position the insertion point in a single cell or click and drag to select multiple cells.

  2. Choose Format, Table. PowerPoint displays the Format Table dialog box.

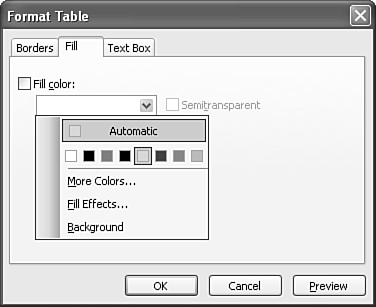
  3. Select the Fill tab (see Figure 8.13, which shows the Fill Color drop-down list box displayed).

    Figure 8.13. You can change the fill or background of table cells by using the Format Table dialog box.

    graphics/08fig13.gif

  4. Select a fill color from the drop-down Fill Color list box. These are the choices:

    • Automatic These are colors that coordinate with the slide design.

    • More Colors These are colors from a Standard or Custom color palette.

    • Fill Effects These effects include gradient shades of two or more colors.

    • Background This is a color that matches the slide's background.

  5. Select the Semitransparent check box if you want the slide's background to show through the fill you've chosen.

  6. Click OK to apply the changes.

Figure 8.14 shows an example of a fill that sets off the table but also allows the background to show through.

Figure 8.14. Semitransparent fills allow the slide's background to show through.

graphics/08fig14.gif


Absolute Beginner's Guide to Microsoft Office PowerPoint 2003
Absolute Beginners Guide to Microsoft Office PowerPoint 2003
ISBN: 0789729695
EAN: 2147483647
Year: 2003
Pages: 154
Authors: Read Gilgen

flylib.com © 2008-2017.
If you may any questions please contact us: flylib@qtcs.net