Monitoring
|
|
In Chapter 6, "Scaling Upward and Outward," we talked about monitoring your system. Most of the examples and performance monitor counters we discussed were really targeted toward determining whether it is time to expand the capacity of your system and to help you find bottlenecks. There is certainly overlap between "insufficient capacity" and a "healthy Exchange server," though.
In this section, we'll look at some Exchange and Windows tools that you can use to determine whether your server is healthy and processing messages.
Checking Queues
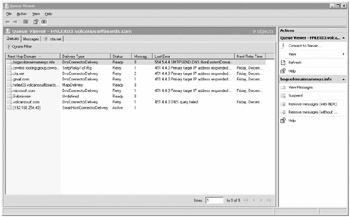
Confirming that e-mail message are being delivered is one of the most basic and important things that you do when managing an Exchange environment. The Queue Viewer tool is usually your front-line monitoring and troubleshooting tool. Queue Viewer is found in the Toolbox work center of the Exchange Management Console. Figure 21.19 shows the Queue Viewer interface.

Figure 21.19: Managing queues on a Hub Transport server
The first thing you need to know about the Queue Viewer is that it communicates with servers that have the Hub Transport role. Since queues are only maintained only on the Hub Transport server, there is no reason for it to communicate with another server role. Figure 21.19 shows the Queue Viewer being used to view the queues on server hnlex03.volcanosurfboards.com; the Microsoft Exchange Transport service must be running on the Hub Transport server. You can use the Connect to Server task in the Actions pane to connect to a different Hub Transport server.
Looking at the queues in Figure 21.19, we can tell a little about the messages that are waiting to be delivered. In this particular environment, server hnlex03 hosts a Send connector and is responsible for delivery to the Internet. It is also a bridgehead server for a legacy Exchange routing group connector to an Exchange 2000/2003 routing group.
The first column in the Queues listing is the Next Hop Domain column; it shows the destination Internet domain, remote smarthost, remote Hub Transport server, or legacy routing group. The Delivery Type column also shows some interesting information about a particular queue:
-
SmtpRelayToTiRg is shorthand for SMTP relay to a Titanium routing group. Titanium is the code name for Exchange 2003, but this queue could be a queue to either Exchange 2000/2003 routing groups.
-
DNSConnectorDelivery is a queue for messages that will be sent directly out to the Internet by using DNS to look up the remote domain's MX records.
-
Undefined is an internal queue that is used to hold messages that have been submitted to the Submission queue but have not been placed in a link queue for delivery to a remote domain, relay, or server.
-
SmartHostConnectoDelivery is a queue that is used to hold messages that are to be delivered to a specific smarthost. The smarthost to be used is specified in the Next Hop Domain column.
-
SMTPRelayWithinAdSite is the queue that is used to hold messages that must be delivered to another Hub Transport in the same Active Directory site. This other server might be a server that hosts an SMTP connector or an Edge Transport connection.
-
STMPRelaytoRemoteAdSite is the queue that is used to hold messages that are being delivered to a Hub Transport server in another Active Directory site.
-
NonSmtpGatewayDelivery is a queue that holds messages that are queued for delivery to a local, non-SMTP gateway. An example of this type of gateway is the Lotus Notes connector.
-
SmtpRelayWithinAdSiteToEdge is a queue that holds messages that are queued for delivery to an Edge Transport server.
-
MapiDelivery is a queue that holds messages queued up for Mailbox servers in the local Active Directory site.
-
Unreachable is a queue that holds message for which a route to the recipient can not be established.
The Status column of the Queue Viewer gives you some indication of what the queue is currently doing. There are four possible status values in the Exchange 2007 Queue viewer:
-
Active means that the message transport system is currently servicing this queue and delivering (or attempting to deliver) messages.
-
Suspended means that the administrator has placed the queue on hold so that no messages in the queue will be delivered.
-
Retry means that there has been a problem delivering the messages in this particular queue and that the message transport system will try to deliver the messages again.
-
Ready means that the queue is currently not servicing any requests but is awaiting the submission of any messages that need to be delivered.
Notice the Last Error column in the Queue Viewer; this column can usually give you some helpful troubleshooting information about why the messages are not being delivered. We have staged a couple of different potential errors in Figure 21.19 that represent some typical problems. We moved the Last Error column over further to the left and widened it some in this screen capture so that you could see it more clearly. In the default Queue Viewer interface, you may need to scroll to the right to see the Last Error column.
-
451 4.4.0 Primary target IP address responded with: "421 4.2.1 Unable to connect." Attempted failover to alternate host, but the attempted failover did not succeed. Either there are no alternate hosts or delivery failed to all alternate hosts. This message indicates that the remote host did not respond. This could be a connectivity problem or it could be that all of a remote domain's servers are down.
-
554 5.4.4 SMTPSEND.DNS.NonExistentDomain. This error indicates that a user has sent a message to a remote SMTP domain that cannot be resolved in DNS. This may be because it does not exist or it could be the result of DNS problems. Unlike previous versions of Exchange, within a few minutes Exchange 2007 will issue a non-delivery report to the user.
-
451 4.4.0 DNS query failed. This error indicates that the domain exists but that mail exchanger (MX) or address records (A) could not be resolved. Exchange will continue to try to look up address records and deliver the message until the time-out period ends (two days by default).
A common complaint about the Queue Viewer interface is that the Last Error column is difficult to read if there is much text in the column. You can move the mouse pointer over the text and you will the text in that column expand in much the same way that" flyover' 'or" mouse over" help works. That still may not be of much help if you need to get a copy of the actual message. That is one place that the EMS cmdlet Get-Queue comes in really handy. Here is a example of using the Get-Queue cmdlet with no parameters:
Get-Queue Identity DeliveryType Status MessageCount NextHopDomain -------- ------------ ------ ------------ ------------- HNLEX03\95 DnsConnec... Retry 2 cta.net HNLEX03\96 DnsConnec... Retry 1 microsoft.com HNLEX03\98 SmartHost... Active 1 [192.168.254.43] HNLEX03\100 DnsConnec... Retry 1 volcanosurf.com HNLEX03\101 DnsConnec... Retry 1 gmail.com HNLEX03\102 SmtpRelay... Retry 3 cn=first routing.. HNLEX03\Submission Undefined Ready 0 Submission
The Get-Queue cmdlet outputs the queue identity; that will prove to be really useful in troubleshooting. You can use this queue identity as input for the Get-Queue parameter; here is an example for getting all of the information for a particular queue:
Get-Queue "hnlex03\95" Identity DeliveryType Status MessageCount NextHopDomain -------- ------------ ------ ------------ ------------- HNLEX03\95 DnsConnec... Retry 2 cta.net
You can pipe the output of the Get-Queue cmdlet to the Format-List cmdlet and get the details of the specified queue:
Get-Queue "hnlex03\95" | FL Identity : HNLEX03\95 DeliveryType : DnsConnectorDelivery NextHopDomain : cta.net NextHopConnector : Status : Retry MessageCount : 2 LastError : 451 4.4.0 Primary target IP address responded with: "421 4.2.1 Unable to connect." Attempted failover to alternate host, that did not succeed. Either there are no alternate host, or delivery failed to all alternate hosts. LastRetryTime : 12/30/2006 11:47:03 AM NextRetryTime : 12/30/2006 11:57:24 AM IsValid : True ObjectState : Unchanged
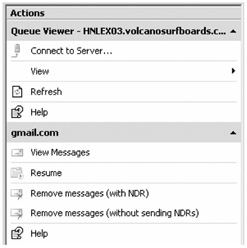
When you highlight a particular queue in the Queue Viewer, the Actions menu gives you a number of different options for managing it. These are shown in this screen shot.

The following tasks appear in the Actions pane when you select a particular queue:
-
View Messages allows you to open a new tab in the Queue Viewer. This is the default behavior if you double-click a queue. The View Messages option creates a tab similar to the one shown in Figure 21.20.
-
Suspend allows you to stop any messages in the specified queue from being delivered. This option will show by default if the queue is not already suspended.
-
Resume allows you to resume delivery of messages in a queue that has been suspended. This option will appear only if a queue has been suspended.
-
Retry forces the message transport system to immediately try to deliver the messages in a particular queue.
-
Remove Messages (With NDR) will delete all of the messages in a particular queue and send the message originator a non-delivery report (NDR) message. This is a nice new capability in Exchange 2007; in previous versions you had to delete messages one at a time.
-
Remove Messages (Without Sending NDRs) will delete all of the messages in a particular queue but not send a non-delivery report (NDR). As with the preceding task, this is a new capability in Exchange 2007; in previous versions you had to delete messages one at a time.

Figure 21.20: Viewing the messages queued up in a specific queue
Notice that a filter is automatically created that filters the messages in a specific queue ID.
The Queue Viewer's Messages tab allows you to see all of the messages that are queued for delivery as well as additional information such as the message size, message subject, and the Queue ID and Last Error columns. The Messages tab also allows you to specify a filter based on the sender, Queue ID, spam confidence level (SCL), Size (KB), date received, expiration time, status, or subject. Figure 21.21 shows the Messages property page with a specific sender filter (From Address) applied.

Figure 21.21: Viewing and filtering all queued messages
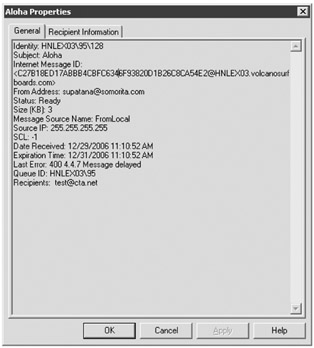
From the Messages tab, you can select one or more messages and suspend, resume, or remove them. There are two remove options; you can remove the message and send an NDR or you can remove the message without sending an NDR. The Properties task on the Actions pane allows you to view more detailed information about the message. The General property page for one of these messages is shown in Figure 21.22.

Figure 21.22: General properties of a queued message
On the General property page, you can see detailed property information about the selected message. This includes the full text of the Last Error message as well as the identity of the message. The identity of the message can be used with the EMS queue management cmdlets Get-Message, Export-Message, Suspend-Message, Resume-Message, and Remove-Message. Hereisanexample of retrieving queued messages using the Get-Message cmdlet:
Get-Message Identity FromAddress Status Queue Subject -------- ----------- ------ ----- ------- HNLEX03\95\128 supatana@som... Ready HNLEX03\95 Aloha HNLEX03\95\131 supatana@som... Ready HNLEX03\95 R&D budget f... HNLEX03\96\134 supatana@som... Ready HNLEX03\96 Outbound mai... HNLEX03\98\140 supatana@som... Ready HNLEX03\98 Product test... HNLEX03\100\143 supatana@som... Ready HNLEX03\100 Can you send... HNLEX03\101\146 supatana@som... Ready HNLEX03\101 More informa...
From this listing, you can get the identity of the message you are interested in viewing more information about. If the listing is larger (dozens or hundreds of messages), you could use the Where cmdlet to narrow the search. For example, if you know that the subject includes the word Aloha, you could use a search such as this:
Get-Message | where {$_.subject -like "Aloha"} Identity FromAddress Status Queue Subject -------- ----------- ------ ----- ------- HNLEX03\95\128 supatana@som... Ready HNLEX03\95 Aloha Once you have the message identity, you can use the following command to retrieve more information about the queued message:
Get-Message "hnlex03\95\128" -IncludeRecipientInfo | FL Identity : HNLEX03\95\128 Subject : Aloha InternetMessageId : <C27B18ED17ABBB4CBFC6346F93820D1B26C8CA54E2@HNLEX03.volcanosurfboards.com> FromAddress : supatana@somorita.com Status : Ready Size : 3284B MessageSourceName : FromLocal SourceIP : 255.255.255.255 SCL : -1 DateReceived : 12/29/2006 11:10:52 AM ExpirationTime : 12/31/2006 11:10:52 AM LastError : 400 4.4.7 Message delayed RetryCount : 0 Queue : HNLEX03\95 Recipients : {test@cta.net} IsValid : True ObjectState : Unchanged Note that this example includes the -IncludeRecipientInfo parameter; if this parameter was not included, the Recipients information would be blank.
Monitoring Health
Performance monitoring is one of the more important tasks that administrators need to do for their mail systems. A clear picture of your server's performance may help you to find bottlenecks or performance problems before they affect your users. Yet performance monitoring is something that most Exchange administrators seem to avoid like the plague.
Performance monitoring is not rocket science; it is not even nearly as difficult as most people think (or fear) it is. Often, the challenge to performance monitoring is in knowing which counters and thresholds indicate a possible performance problem. We hope to remedy that in this chapter, but at the very least we hope to get you started.
If you have not read Chapter 6, you should go back and review the section on performance monitoring. There is quite a bit of overlap between these two chapters, though in that chapter we focused on counters that might indicate the need to scale additional servers or add additional hardware resources. In this chapter, we are going to focus more on counters that indicate performance problems and server health.
Using Performance Monitoring Counters
Let's now look at some of the counters that you may find useful when monitoring performance problems or looking for bottlenecks. Before we jump into this discussion, though, here's a review of a few tips for performance monitoring:
-
Don't sweat spikes in activity. You are interested in average activity over a typical period of time.
-
Monitor over a few hours rather than a few minutes.
-
Pick periods of typical activity. If most of your user community arrives at work at 8:00 in the morning and leaves for lunch at 11:30, then monitor during that period of time.
-
Record performance monitor counter logs. You can analyze them later and refer back to them for historical information.
-
Avoid performance monitoring immediately after restarting the server. On a mailbox server, a freshly restarted server is in what is called a cold state operation; this is when the Exchange server is just beginning to cache frequently used data. The disk I/O profile and CPU usage will be higher than normal.
-
Performance monitoring is one part science and one part art. Take every counter value that you measure and think about what factors could cause that particular value to be too high (or too low).
Memory Counters
Provided you have sufficient memory in your server, it won't usually be a bottleneck for Exchange 2007. We recommend that you have more than just the minimum amount of RAM in your servers. If you suspect memory problems, there are some counters that will prove to be very useful when making this determination. Table 21.4 shows some common performance monitor counters and some recommended values to watch for.
| Object/Counter | Explanation\Recommendation |
|---|---|
| Memory/Pages/sec | This is the number of pages per second that Windows had to either retrieve from the page file or write to the page file due to a shortage of physical memory. This value should not exceed an average of 10 pages per second during typical activity. |
| Memory/Available Mbytes | This is the total amount of physical memory that is available to Windows. This value should be greater than 10 percent of the total amount of physical memory in the server. |
| Process/Working Set | The Working Set counter for each instance of the process running on Windows can be viewed and this can give you an idea of how much memory each of the processes running in Windows are allocating. |
Processor Counters
In most cases, the processor subsystem of a server is not usually the bottleneck or the cause of performance problems. Table 21.5 shows some of the common counters that you can us
EAN: 2147483647
Pages: 198