Choosing the Data to Collect
3 4
There is no set quantity of counters that should be collected for post-capacity planning. The counters you use depend on the data you are analyzing and the degree of detail you want. In addition to the counters that we have described so far, Performance Monitor provides many other performance counters that you might find useful in certain situations. We'll look at one such situation here—collecting information about processes.
Collecting Process Data
Process information can be valuable when you are profiling a workload activity. Profiling a workload means determining what work each user is actually performing. Performance Monitor provides a variety of counters for this purpose. These counters are similar to the counters in the Processor object, but in this case they are used to collect process data. These counters can be found in the Process object and include the following:
- % Processor Time Percentage of elapsed time during which all of the threads of this process used the processor to execute instructions. Code executed to handle certain hardware interrupts or trap conditions may be counted for this process.
- % User Time Percentage of elapsed time this process's threads have spent executing code in User mode.
- % Privileged Time Percentage of elapsed time that this process's threads have spent executing code in Privileged mode.
- Page Faults/sec Rate of page faults by the threads executing in this process.
- Elapsed Time Total elapsed time (in seconds) the process has been running.
Analyzing Process Data
Analyzing this information is not as complex as you might think. For example, if we were analyzing a system's processes to determine what kind of work was being performed, we would collect process data using a counter such as % Processor Time. This counter would indicate how much of the system is devoted to a certain function. Figure 6-9 shows the user process growth in a CalProc query, which is used by an accounts payable department.
This information is helpful because we can predict what will happen if we add more accounts payable users. In the graph, the trend line shows that utilization is rising and will be up to 30 percent by February 18, 2000. Assuming 10 accounts payable users, we could estimate that each user is responsible for 3 percent utilization in February. We can then deduce that if we add 3 users in February, we will be at approximately 39 percent utilization for the CalProc query.
When determining what to measure, it is important to decide what you are analyzing, as this will determine the measurement configuration you use. If your post-capacity study is ongoing, remember that you don't want to contribute to any performance problems—that is, if you decide that you want to measure everything and set a small measurement interval, you're going to be adding to any performance problems that may already exist. The smaller your measurement interval, the more often your record will be written to the disk, and if you're measuring a large number of counters this record will be very large. Multiple records are the way to go when your performance analysis necessitates having a smaller interval to trap performance problems. However, a single record written per day is fine for capacity studies.
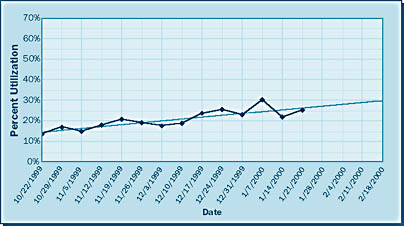
Table 6-1 provides a list of the counters you should use for a good basic capacity planning study. Remember that not all these counters reside in Performance Monitor. Available Memory can be retrieved using the Task Manager. Disk Space Used and Disk Space Available can be retrieved using the Disk Administrator.
Table 6-1. Counters available in Performance Monitor
| Object | Counters |
|---|---|
| Processor | % Processor Time (individual CPU statistics) |
| System | % Total Processor Time (averaged over all CPUs) |
| PhysicalDisk | % Disk Time (for all disk arrays configured) Avg. Disk Queue Length |
| Memory | Page Faults/second Available Memory |
| Network Segment | Total Bytes Received/second |
This configuration provides a good starting place for performing predictive analysis on your system. All the necessary elements are present to give information about CPU utilization and disk, memory, and network usage without putting excessive stress on the system and while maintaining a smaller database. As you get more involved in the study, you can add counters to extend the information that you can provide.
EAN: N/A
Pages: 264