Discovering the Problem
3 4
To determine whether your system is experiencing problems, you can first make some general observations about system performance. For example, find out whether users are experiencing slower-than-expected response times when they perform database queries and modifications. This is a common symptom of a performance problem or a bottleneck. You might notice, for example, that when a certain query is run, all the other operations being performed on the system run more slowly than they usually do. You would therefore focus on optimizing the query that is causing the problem, or you could try running it at a time when fewer users are accessing the system.
Another way to determine whether a problem exists is to periodically test and monitor the system. You can use several tools to do so, including Windows 2000 System Monitor and SQL Server Enterprise Manager. In this section, you'll learn how to use these two tools to examine the health of your system. You'll also be introduced to the sp_who stored procedure, which you can use to monitor active SQL Server processes.
NOTE
Refer to Chapter 35 if you need instructions for using SQL Profiler and SQL Query Analyzer to detect performance problems that relate to your SQL statements.
System Monitor
Windows 2000 System Monitor provides not only Windows 2000 counters but also SQL Server counters. These counters monitor system characteristics, such as the percent of CPU utilization or the SQL Server cache hit ratio, which help you determine what is happening in your system. (Information about specific performance counters is provided throughout this chapter.) You can watch the monitoring in real time, or you can log the data to a file and look at the data later.
To use System Monitor to monitor your system, follow these steps:
- Click Start, point to Programs, point to Administrative Tools, and then choose Performance to display the system monitor window.
- Specify whether you want to view the counter data in chart, report, or histogram form or to view data previously saved to a log file by clicking the appropriate button on the toolbar. Figure 36-1 shows a chart view in System Monitor. If you choose to view a log file, a dialog box appears in which you choose the file to open.
Figure 36-1. Windows 2000 Performance.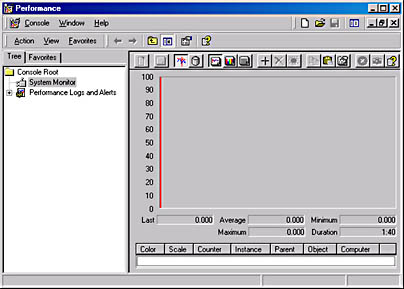
- To add a counter to be viewed in the Performance window, click the plus sign button on the toolbar. The Add Counters dialog box appears, as shown in Figure 36-2. Click Use Local Computer Counters to view counters for the local system, or click Select Counters From Computer and select the name of a remote computer from the drop-down list beneath the option button to view counters for that computer.

Figure 36-2. The Add Counters dialog box.
- Select a System Monitor object from the Performance Object drop-down list. These objects represent system components. The counters for the object you select are then shown in the list box in the bottom left corner of the dialog box. If you want to observe all the object's counters, click All Counters. If you want to monitor only certain counters, click Select Counters From List, and select the counters from the list. For certain counters, more than one instance exists; these instances are shown in the list box in the bottom right corner of the dialog box. Click Select Instances From List if you want to select one or more particular instances to view, or click All Instances to view them all.
- Click Add. The counter or counters you selected are added to the Performance window. (If you selected multiple instances of a counter, they are all added.) You can then continue to add counters. Click Close when you are ready to return to the Performance window. You will now be able to see the performance data provided by the counters. Figure 36-3 shows a chart view displaying the results returned by three counters: Context Switches/Sec, Total Server Memory (KB), and % Processor Time.
Figure 36-3. System Monitor in action.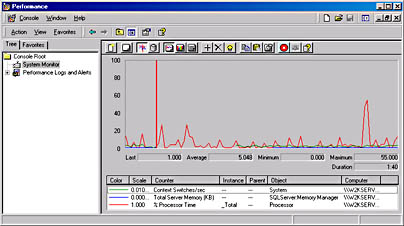
To save performance data to a log file, follow these procedures:
- Expand Performance Logs And Alerts in the left pane of the Performance window. Right-click Counter Logs and choose New Log Settings from the shortcut menu. The New Log Settings dialog box appears. Here you type a name of your log settings, as shown in Figure 36-4. Click OK to continue.

Figure 36-4. The New Log Settings dialog box.
- The window named after your new log file appears. In the General tab, click Add. In the Add Counters dialog box that appears, select the counters that you want to be logged, as described in steps 3 through 5 in the preceding description of how to use System Monitor to monitor your system. The General tab also lets you change the log file name and specify how often performance data is sampled.
- Click the Log Files tab to set additional properties of the log file. Figure 36-5 shows the settings for a file that will have a date added to the end of its name and that will be created as a binary file.

Figure 36-5. The Log Files tab of a new log file's window.
- Click the Schedule tab. In this tab, you assign a start time and a stop time for the log file. You can also choose to start a new log or run a command when the current log file closes.
- Click OK to close the window and to save your log file information. If you chose to start the log immediately, it will start when you click OK. An entry for the log file will appear in the Performance window, as shown in Figure 36-6.
Figure 36-6. The Performance window, showing an entry for a new counter log.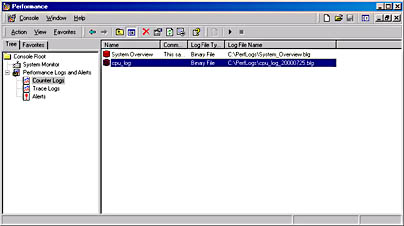
You should use System Monitor on a regular basis to check the state of your system. Monitoring on a daily or weekly basis is a good idea because it lets you get to know your system, which enables you to recognize out-of-the-ordinary events. Saving the performance data in a log file for later inspection is also recommended—the data in the log file will come in handy when you want to compare performance data logged before a change is made to the system to the data logged after a change is made to determine whether the change was a good one. You can also use the logs to find out how user and system activity changes from one day to another. For example, you might notice that during the last few days of the month, user activity is much higher than at other times. You'll want to ensure that your system is capable of handling the load at those times of peak usage.
Enterprise Manager
In addition to using Enterprise Manager to automate day-to-day administrative functions, you can use it to assist with monitoring SQL Server processes and locks. (See Chapter 19 for information about locking.) For example, you can gather data about which processes are using locks and about which objects are being locked—an object in this case being a table, a database, or a temporary table. To view this information, follow the steps below.
- In the Enterprise Manager window, expand Microsoft SQL Server, expand SQL Server Group, expand the server, expand the Management folder, and expand Current Activity, shown in Figure 36-7. The Current Activity folder contains three folders: Process Info, Locks / Process ID, and Locks / Object.
Figure 36-7. The expanded Current Activity folder in Enterprise Manager.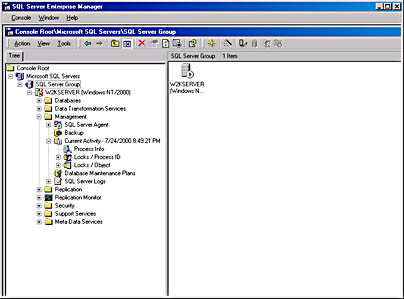
- Click Process Info to view the names of users who are currently connected to SQL Server; the process IDs of those users; the status of the user processes (running, sleeping, or background); the database each user is connected to; the commands and application each user is running; the wait time (the time a user spends waiting for a resource to become available); the CPU, physical I/O, and memory usage of each process; and the blocking status of each process (whether the process is blocking others or is being blocked by others). To see all of the information, you will have to scroll to the right. Figure 36-8 shows some of this information.
Figure 36-8. The Process Info information in Enterprise Manager.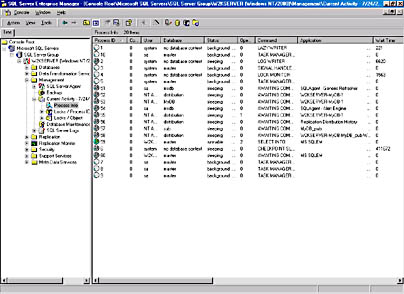
- Click Locks / Process ID to view in the right pane the list of system process identification numbers (SPIDs) of the currently active processes, shown in Figure 36-9. Double-click a SPID in the right pane to view the Process Details dialog box, shown in Figure 36-10. This dialog box shows the last T-SQL command the selected process ran.
Figure 36-9. SPIDs shown in the Locks / Process ID pane.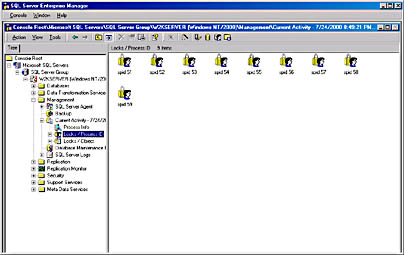
Figure 36-10. The Process Details dialog box.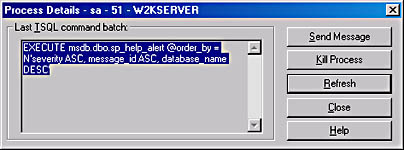
- Expand the Locks / Process ID folder to view the current SPIDs in the left pane, shown in Figure 36-11.
Figure 36-11. The expanded Locks / Process ID folder.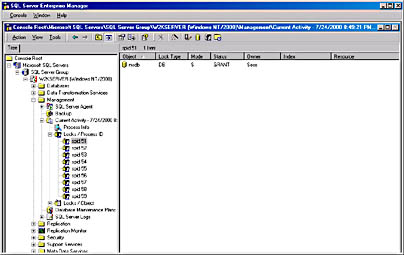
- Click a SPID in the left pane to view the lock information for that process in the right pane, also shown in Figure 36-11. This information includes the lock type, the lock mode, the status of the lock, and the lock owner. The lock type can be one of the following:
- RID Row lock
- KEY Row lock within an index
- PAG Data or index page lock
- EXT Extent lock
- TAB Table lock, which includes all data and index pages for the locked table
- DB Database lock
The lock mode can be one of the following:
- S Shared lock
- X Exclusive lock
- U Update lock
- BU Bulk update lock
- IS Intent shared
- IX Intent exclusive
- SIX Shared with intent exclusive
- Sch-S Schema lock for compiling queries
- Sch-M Schema lock for DDL operations
The status of a lock can be one of the following:
- GRANT Means that the lock has been granted to the selected process
- WAIT Means that the process is blocked by another process and is waiting for a lock
- CNVT Means that the lock is being converted to another type of lock
- Expand the Locks / Object folder to view a list of objects that are locked, as shown in Figure 36-12. Objects that can be locked include tables, temporary tables, databases, and so on.
Figure 36-12. The expanded Locks / Object folder.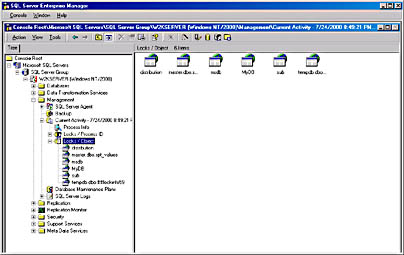
- Click the name of a locked database or table to view its locking information in the right pane, as shown in Figure 36-13. The information shown is the same as that shown when a SPID in the Locks / Process ID folder is clicked, just from a different perspective.
Figure 36-13. Viewing lock information for an object.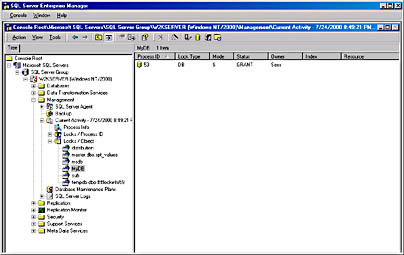
The sp_who Stored Procedure
You can also view information about active processes by running the following command in Query Analyzer or at an OSQL prompt:
sp_who active GO
Sample results from running this command in Query Analyzer are shown in Figure 36-14. If a process is being blocked, the "blk" column will show the SPID of the process that is blocking it.
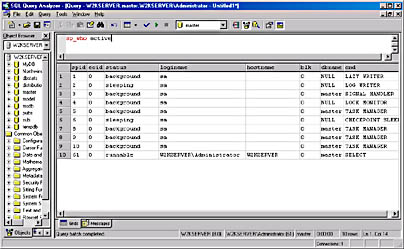
When users complain that their transactions are slow, you can run this command to find blocks. Many times, you will find that most of the blocked processes are being blocked by one process, and once you find what process that is, you can determine why it is holding locks for so long.
You should occasionally monitor locking to determine whether any processes are holding a lock for a long period of time and whether processes are being blocked often (they have a WAIT status) because of exclusive locks or table locks held by other processes. But usually, you will get complaints from users about slow response times if blocking is a problem. If blocking is occurring too often or for long periods of time, you might want to determine which processes are holding the exclusive locks or table locks that might be the cause of the blocking and to monitor the SQL statements those processes are running. Then try to optimize those statements, if possible, so that they release the locks sooner or do not hold exclusive table locks. In general, when a process has to wait to obtain a lock, the process takes more time to finish. Therefore, reducing locking contention can improve transaction response times.
MORE INFO
For more details about viewing lock information, look up "displayinglocks," in Books Online and select "Displaying Locking Information" in the Topics Found dialog box.
EAN: N/A
Pages: 264
- Challenging the Unpredictable: Changeable Order Management Systems
- ERP System Acquisition: A Process Model and Results From an Austrian Survey
- The Second Wave ERP Market: An Australian Viewpoint
- Enterprise Application Integration: New Solutions for a Solved Problem or a Challenging Research Field?
- Healthcare Information: From Administrative to Practice Databases