Creating Diagrams by Using SmartArt
|
|
| As an international delivery company, Consolidated Messenger's business processes are quite complex. Many times, chief operating officer Jenny Lysaker summarizes the company's processes for the board of directors by creating diagrams. Excel 2007 has just the tool she needs to create those diagrams: SmartArt. To create a SmartArt graphic, on the Insert tab, in the Illustrations group, click SmartArt to display the Choose a SmartArt Graphic dialog box. 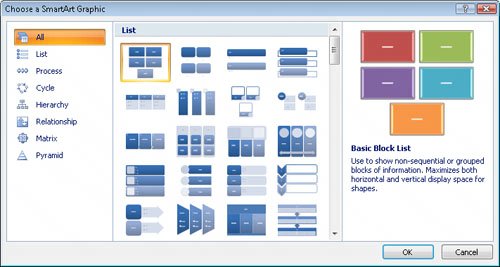 See Also For more information on adding pictures from existing files to your worksheets, see "Adding Images to a Document" in Chapter 5. Clicking one of the buttons in the Choose a SmartArt Graphic dialog box selects the type of diagram the button represents and causes a description of the diagram type to appear in the rightmost pane of the dialog box. Clicking All displays every available SmartArt graphic type. The following table lists the seven types of diagrams you can create by using the Choose a SmartArt Graphic dialog box. Tip Some of the diagram types can be used to illustrate several types of relationships. Be sure to examine all your options when you decide on the type of diagram to use to illustrate your point.
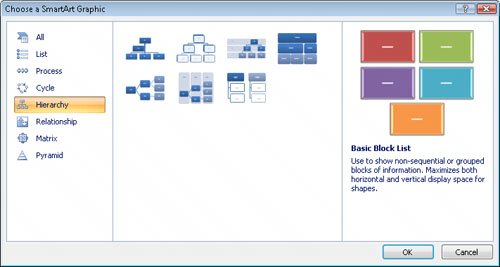
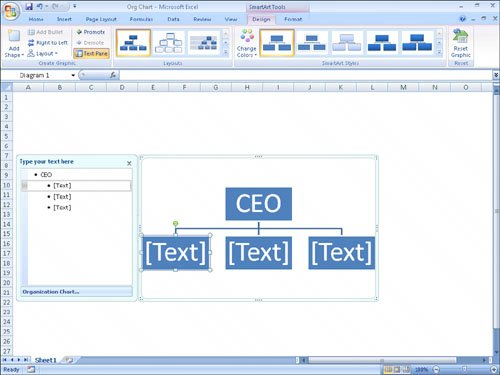
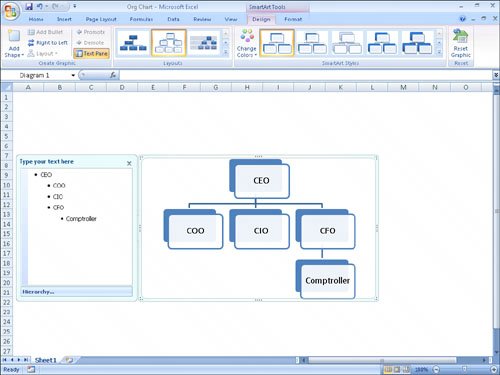
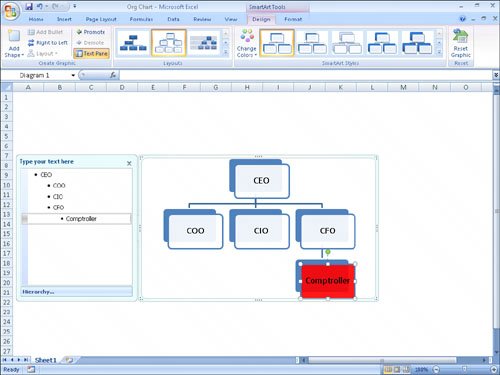
After you click the button representing the type of diagram you want to create, clicking OK adds the diagram to your worksheet. 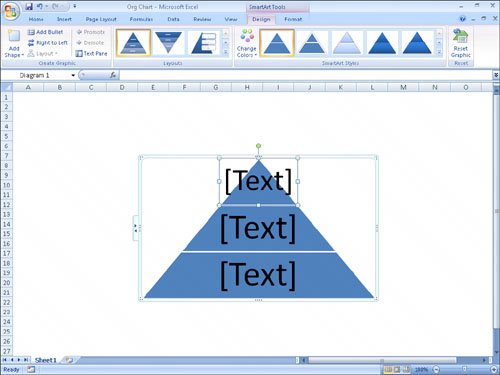 While the diagram is selected, Excel 2007 displays the SmartArt Tools contextual tabs named Design and Format. You can use the tools on the Design contextual tab to change the graphic's layout, style, or color scheme. The Design contextual tab also contains the Create Graphic group, which is home to tools you can use to add a shape to the SmartArt graphic, add text to the graphic, and promote or demote shapes within the graphic. As an example, consider a process diagram that describes how Consolidated Messenger handles a package within one of the company's regional distribution centers. 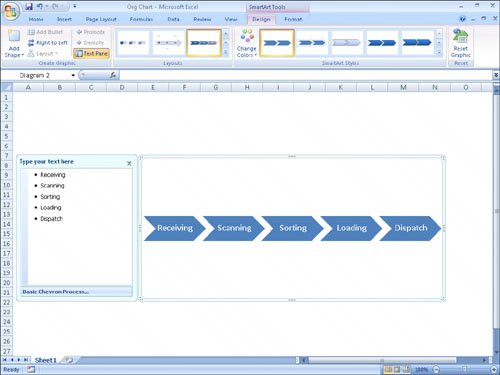 The Text Pane, located to the left of the SmartArt graphic, enables you to add text to a shape without having to click and type within the shape. If you enter the process steps in the wrong order, you can move a shape by right-clicking the shape you want to move and then clicking Cut from the shortcut menu that appears. To paste the shape back into the graphic, right-click the shape to the left of where you want the pasted shape to appear and then click Paste. For example, if you have a five-step process and accidentally switch the second and third steps, you can move the third step to the second position by right-clicking the third step and then clicking Cut. Then right-click the first shape and click Paste. If you want to add a shape to a SmartArt graphic, such as add a step to a process, click a shape next to the position you want the new shape to occupy and then, on the Design contextual tab, in the Create Graphic group, click Add Shape, and then click the option that represents where you want the new shape to appear in relation to the selected shape. Note The options that appear when you click Add Shape depend on the type of SmartArt graphic you created and which graphic element is selected. For an organizational chart, the options are Add Shape After, Add Shape Before, Add Shape Above, Add Shape Below, and Add Assistant. You can edit the graphic's elements by using the controls on the Formatting contextual tab as well as by right-clicking the shape and then clicking Format Shape to display the Format Shape dialog box. If you have selected the text in a shape, you can use the tools in the Home tab's Font group to change the text's appearance. Tip The controls in the Format Shape dialog box enable you to change the shape's fill color, borders, shadow, 3-D appearance, and text box properties. In this exercise, you create an organization chart, fill in the shapes, delete a shape, add a shape, change the layout of the diagram without changing the information it embodies, and change the formatting of one of the diagram elements.
USE the Org Chart workbook in the practice file folder for this topic. This practice file is located in the My Documents\Microsoft Press\Excel SBS\Charting folder. OPEN the Org Chart workbook.
CLOSE the Org Chart workbook. CLOSE Excel 2007. |
|
|
EAN: 2147483647
Pages: 143
- Challenging the Unpredictable: Changeable Order Management Systems
- ERP System Acquisition: A Process Model and Results From an Austrian Survey
- Enterprise Application Integration: New Solutions for a Solved Problem or a Challenging Research Field?
- The Effects of an Enterprise Resource Planning System (ERP) Implementation on Job Characteristics – A Study using the Hackman and Oldham Job Characteristics Model
- Data Mining for Business Process Reengineering