Creating Charts
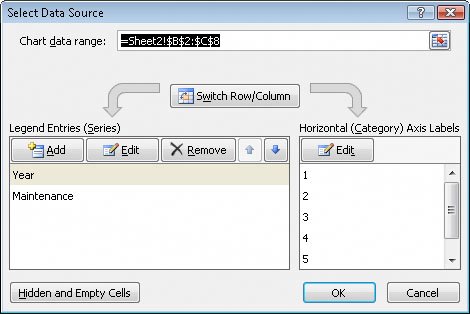
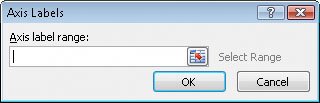
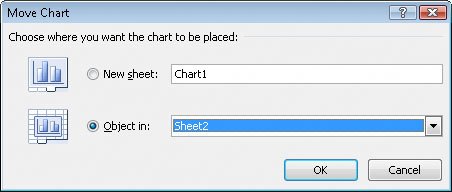
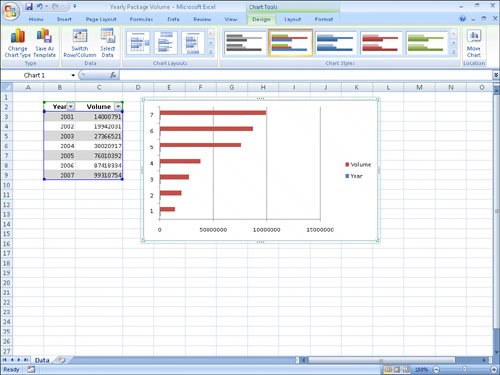
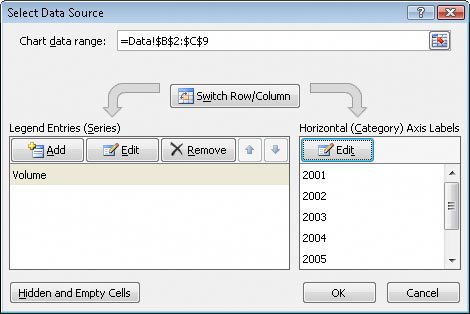
| To create a chart, select the data you want to summarize visually and then, on the Insert tab, in the Charts group, click the type of chart you want to create to have Excel 2007 display the available chart subtypes. 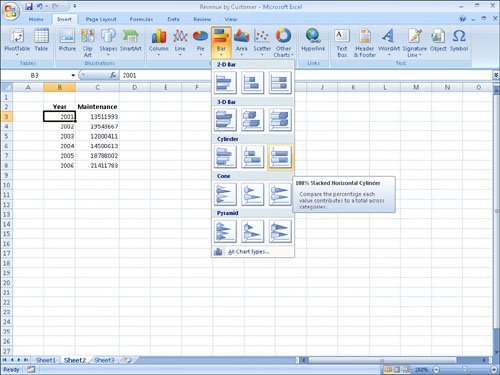 When you click your desired chart subtype, Excel 2007 creates the chart using the default layout and color scheme defined in your workbook's theme. The following graphic shows a column chart and the data used to create it. 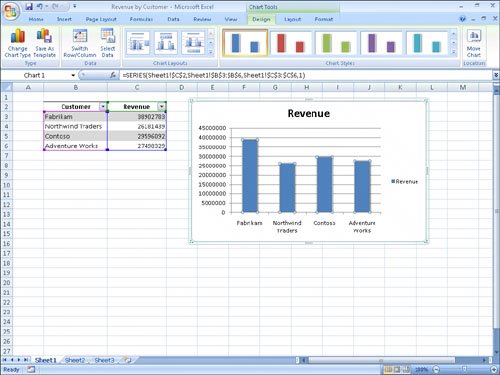 If Excel 2007 doesn't plot your data the way you want, you can change the axis on which Excel 2007 plots a data column. The most common situation in which Excel 2007 plots data incorrectly is when the column you want to provide values for the horizontal axis contains numerical data. For example, if your data list contains a Year column and a Volume column, Excel 2007 plots both of those columns in the body of the chart and creates a sequential series to provide values for the horizontal axis. If your data set contains one column of text values and another column of numerical values, the Excel 2007 chart engine plots the data correctly. You can change which data it applies to the vertical axis (also known as the y-axis) and the horizontal axis (also known as the x-axis). To make that change, select the chart and then, on the Design tab, in the Data group, click Select Data to display the Select Source Data dialog box. The Year column doesn't belong in the Legend Entries (Series) pane, which corresponds to a column chart's vertical axis. To remove a column from an axis, select the column's name and then click Remove. To add the column to the Horizontal (Category) Axis Labels pane, click that pane's Edit button to display the Axis Labels dialog box. In the Axis Labels dialog box, click the Contract Dialog button at the right edge of the Axis Label Range field, select the cells to provide the values for the horizontal axis (not including the column header, if any), click the Expand Dialog button, and then click OK. Click OK again to close the Select Data Source dialog box and revise your chart. After you create your chart, you can change its size to reflect whether you want the chart to dominate its worksheet or take on a role as another informative element on the worksheet. For example, Gary Schare, the chief executive officer of Consolidated Messenger, could create a dashboard to summarize the performance of each of his company's business units. In that case, he would display multiple measures on the same worksheet, so he would want to make his charts as small as possible without sacrificing comprehensibility. To resize a chart, select the chart and then drag one of the handles on the chart's edges. Handles in the middle of the edges enable you to resize the chart in one direction. Dragging a handle on the left or right edge enables you to make the chart narrower or wider, whereas dragging the handles on the chart's upper and lower edges enable you to make the chart shorter or taller. Dragging a corner handle enables you to change the chart's height and width at the same time; holding down the Shift key as you drag the corner handle changes the chart's size proportionally. Just as you can control a chart's size, you can also control its location. To move a chart within a worksheet, drag the chart to the desired location. If you want to move the chart to a new worksheet, click the chart and then, on the Design contextual tab, in the Location group, click Move Chart to display the Move Chart dialog box. To move the chart to a new chart sheet, select the New sheet option button and type the new sheet's name in the accompanying field. Selecting the New sheet option creates a chart sheet, which contains only your chart. You can still resize the chart on that sheet, but when Excel 2007 creates the new chart sheet, the chart takes up the full sheet. To move the chart to an existing worksheet, select the Object In option button, click the accompanying field down arrow, and then click the worksheet to which you want to move the chart. In this exercise, you'll create a chart, change how the chart plots your data, resize your chart, move your chart within a worksheet, and move your chart to its own chart sheet.
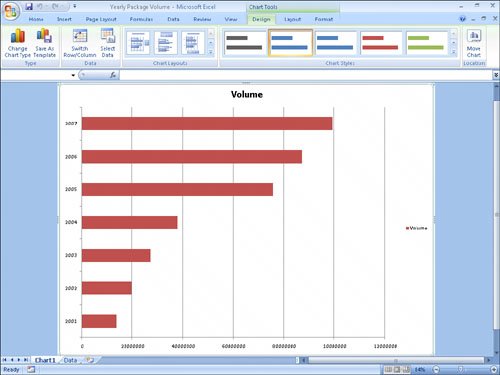
USE the Yearly Package Volume workbook in the practice file folder for this topic. This practice file is located in the My Documents\Microsoft Press\Excel SBS\Charting folder. BE SURE TO start Excel 2007 before beginning this exercise. OPEN the Yearly Package Volume workbook.
CLOSE the Yearly Package Volume workbook. |
EAN: 2147483647
Pages: 143