Hack 65. Give Credit Where Credit Is Due
| Stylometrics is a statistical procedure that identifies the underlying dimensions that define an author's style. It uses the method of factor analysis to judge who wrote what. Professor Howe-Mutch had a problem. Two of his best students were sitting in his office, hoping to resolve a dispute. Dr. Howe-Mutch had awarded an A+ to Paul's final paper (on the historical importance of chocolate milk). The problem was that Lisa claimed to have written it. An accusation of plagiarism had been made! Both were good students who had written many quality papers for him in the past. So, the solution as to true authorship was not a simple one, nor was the realization that one of his favorite students was a cheat. Fortunately, the good doctor of philosophy had many years of experience and was wiser than his adjunct position at State Community College and Trucking School might have suggested. Among other obscure statistical hobbies, Dr. Howe-Mutch dabbled in the art of stylometry, a statistical method for categorizing the style of written works. The method can also be used to identify anonymous authors. It works best when there are a couple of possibilities or suspects to choose from, and when the typical writing styles of the suspects are known and have been quantified. Let's watch as the broken-hearted professor applies these techniques to find the true author. Building a ModelFirst, Dr. Howe-Mutch asks Paul and Lisa to bring in all the other papers they have each written in the past and about which there is no dispute. In just a few moments, the papers are scanned into a computer, providing a database of all the different words used by both writers.
For the first analysis, all the words written by the two writers are kept together. Dr. Howe-Mutch counts the frequency with which each word is used and identifies the 50 to 100 most commonly used words in the combined database. These words become the items or key variables that supply the data for a factor analysis. Factor analysis is a statistical process that looks at the correlations [Hack #11] among groups of variables and identifies clusters of variables that correlate better among themselves than they do with other variables. Whatever these grouped-together variables have in common is assumed to be a factor, component, or dimension that they all share. For the sake of our story, I'll show only 10 of the words that Dr. Howe-Mutch identified as most common across both writers' works. Table 6-14 shows the words and their frequency of use. When looking at all the words Paul and Lisa wrote, the was used 4.2 percent of the time, weasel was used 1 percent of the time, and so on.
These words act as variables to try to identify the underlying factors that describe one or more dimensions of style. Paul and Lisa's styles might be at different places along these dimensions. It might be that only one dimension or factor is necessary to account for variability in the usage of these words, or there might be many dimensions. Once these dimensionsdefined by the variables that correlate together, or load, on the dimensionare identified, any writing sample could be placed in the theoretical space framed by the factors. The data for Dr. Howe-Mutch's factor analysis are supplied by each section of 500 words in the writing samples. Each section receives a score on each of the word variables. The score will be the number of times the word is used in that paragraph. Table 6-15 shows examples of the data Mr. Howe-Mutch collects.
Factor AnalysisNext, Dr. Howe-Mutch performs the factor analysis, a fairly complex mathematical process that these days is done using computers, while the researcher makes many theory-driven decisions at different points along the way. Basically, the factors are identified by exploring the relationships among variables until a small number of variable groupings are found that seem to account for as much variability as possible across the data. The commonality shared by variables in each grouping provides the mathematical fodder that defines the factor. Once the factors are chosen, any observationin this case, a sample of textcan receive scores on the factor and then be placed in that theoretical space, with the factor scores serving as coordinates. In this case, the analysis suggests that two factors do a good job of describing the sample texts. Factor 1 is defined by the use of words such as the and a/an at one end and of and in at the other. In other words, the text sections differed based on how frequently they used articles, and the sections that had a higher frequency of article use tended to be lower in their use of prepositions. Factor 2 is defined by the frequency of the use of the word weasel. In exploratory factor analysis, typically researchers are interested in discovering and naming the underlying constructs (i.e., invisible traits) that account for human behaviors and characteristics. For this use, though, Professor Howe-Mutch is interested only in defining these dimensions based on the variables (e.g., word use) that anchor them at both ends. He is not interested in figuring out why those text sections that tend to contain the word the frequently also tend to contain a or an frequently. He also is not interested in why the use of the word weasel could distinguish between his different writing samples. For his purposes, he is content just knowing that these two factors provide a couple of good axes to map the space of all words that the two authors chose to use in their samples. When the factor scores from each of Paul and Lisa's sample papers are computed, it becomes clear that the two authors have different styles. Lisa tends to use the word weasel more frequently than Paul; her papers score high on Factor 2. Lisa's papers also tend toward the high use of articles and receive fairly high Factor 1 scores. Paul's papers, on the other hands, tend to avoid the use of the word weasel and tend toward the preposition end of Factor 1. This is difficult to grasp using words alone, so an illustration will help draw a picture to demonstrate the placement of the sample texts. Figure 6-5 shows the two factors, the word usage that defines them, and where the different writing samples loaded on the two factors. For the sake of convenience for this discussion, Figure 6-5 displays only a few of the writing samples and maps only the 10 words in Table 6-14 and Table 6-15. Also included in the figure is the placement of the disputed paper in this theoretical dimensional space. Figure 6-5. Factor analysis of text samples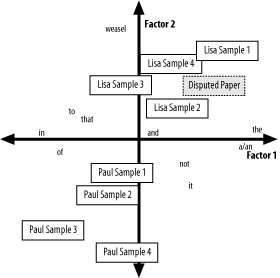 The solution to the mystery is now clear. The disputed paper shares the characteristics of Lisa's papers, not Paul's. Because Paul and Lisa's earlier papers display a consistent but different style, at least as defined by word counts, the factor map is a useful tool to identify the most likely author of the paper. Dr. Howe-Mutch awards the A+ to Lisa, accuses Paul of plagiarism, and is now engaged in a lengthy court battle with Paul's attorneys, which will no doubt leave our fine statistician friend penniless. The important thing, though, is that a statistical procedure was able to make the invisible visible. Science triumphed once again. See Also
|

EAN: 2147483647
Pages: 114