Advanced OLAP Intelligence Designer Tools
| The chapter up to this point has introduced the most traditional and common multidimensional or OLAP analytic objects with the Worksheet and Charting objects. OLAP Intelligence provides four other analytic objects that can be used to enhance and extend end-user interactivity with the involved reports past the traditional boundaries of other OLAP Client products. The next few sections introduce their powerful capabilities. Using Dimension Explorer Objects in OLAP IntelligenceThe Dimension Explorer gives users direct control of the view of a cube from outside of the worksheet. This object, shown in Figure 19.37 with all options turned on, enables users to dynamically change cube orientation (that is, which dimensions or on what axes) and member selection across one or all dimensions. Changes that take place within Dimension Explorer directly affect the other analytic objects on the same page (such as a Worksheet or Chart). Table 19.4 highlights the different components of the Dimension Explorer, and their functions and typical uses. Configure these by right-clicking to access the Properties menu of the involved Dimension Explorer.
As you might have surmised, the Dimension Explorer does not provide any new functionality over the worksheet introduced in the last chapter but it does provide another method of deploying a good degree of dimension exploration and reorientation functionality to the end user. Figure 19.40 highlights an OLAP Intelligence report presenting a Dimension Explorer based off the sample KPI cube provided by Crystal. Figure 19.38. An OLAP Intelligence report showing a Dimension Explorer with three Favorites groups defined and one selected to drive the appearance of the corresponding Chart object.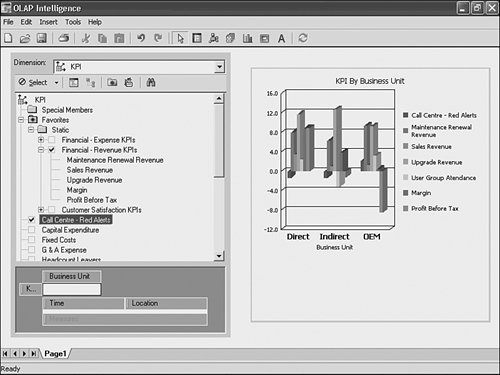 Tip The Pivot Control and Member Selection capabilities of the Dimension Explorer can provide a report design option for designers who want to restrict end users' capabilities. By including these within a Dimension Explorer on a report page, end users will be able to manipulate dimensions and member selections in a report but will not be able to access any of the remaining worksheet functionality covered in the previous chapter (such as calculations, filtering, sorting, exception highlighting, formatting, and so on). As discussed earlier in this chapter, the chart in Figure 19.37 reflects the viewpoint of the page on which it is located. With the Dimension Explorer, you relieve the requirement of needing a worksheet on the same report page as a chart to make it interactive because the content of the chart can be driven exclusively through the Dimension Explorer. Try to re-create this report yourself, complete with new Favorites group called Customer Satisfaction and FinanceRevenue Related. Note In addition to enabling end users to create favorite member groupings and selections, OLAP Intelligence provides support for Server-side Named Sets created in Microsoft SQL Server Analysis Services. The Named Sets, which are themselves server-defined custom member groupings (such as Top 10 Selling Products), appear under a new Server node found under the Favorites node in the Member Selector. Using the Slice Navigator ObjectsThe Slice Navigator object enables users to explore and edit the current viewpoint's slice dimensions and their associated members. The Slice Navigator, shown in Figure 19.39, is best thought of as an in-line parameter selection mechanism for the OLAP Intelligence Report. Figure 19.39. The Slice Navigator object and its components enables quick parameter or member selection from the paged or slice dimensions.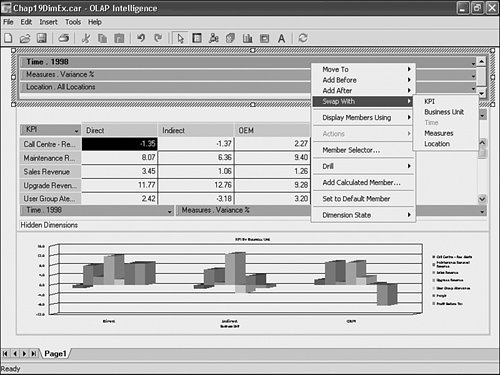 Changes that take place within the Slice Navigator directly affect the other analytic objects on the same page (such as a Worksheet or Chart). Table 19.5 highlights the different components of the Slice Navigator and their functions and typical uses. These are configurable by right-clicking the Properties menu of the involved Slice Navigator.
Use the Slice Navigator on OLAP Intelligence Report Pages when you want to present a locked-down worksheet or chart view (that is, no dimension reorientation) yet still want to enable the end user to edit the parameters around the fixed display (that is, edit the sliced dimension members). Figure 19.40 highlights a report page based on the Crystal Sample KPI cube with the Slice Navigator providing a parameter selection capability that drives the chart and worksheet display. Figure 19.40. Here is an OLAP Intelligence report with the Slice Navigator driving a Viewpoint reflected on the corresponding Chart and Worksheet objects.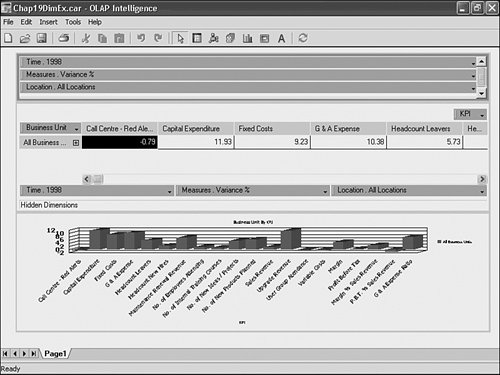 Using Analysis Button ObjectsAnalysis Buttons enable end users to rapidly analyze data and move between different analytic viewpoints at the click of a button. The simple user interface that Analysis Buttons provide brings the power of OLAP and multidimensional data sources to the masses. Analysis Buttons enables single-click provision of any of the following capabilities to end users:
Figure 19.41 shows a familiar sample report that has been enhanced with the provision of three Analysis ButtonsCustomer Satisfaction, FinanceRevenue Related, and All KPIs. Figure 19.41. This is an OLAP Intelligence report with three Analysis Buttons driving the viewpoint reflected on the corresponding Chart and Worksheet objects.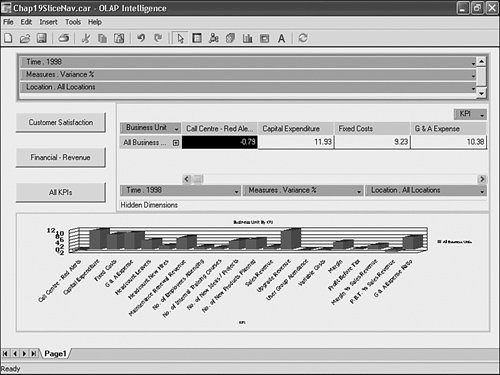 Each of the three Analysis Buttons provides the end user with a single-click method of changing the viewpoint on the associated worksheet and chart objects (after the OLAP Intelligence report has been locked down or published to BusinessObjects Enterprise). The report designer provides this capability by right-clicking on the Analysis button after it has been added to a report page. Figures 19.42 and 19.43 highlight the Analysis Button Properties dialog accessed by right-clicking on an Analysis Button and selecting Properties. Figure 19.42. The Analysis Button Properties dialog is where you name the Analysis Button and select a transition page or action.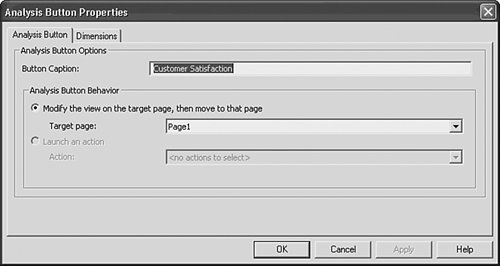 Figure 19.43. On the Dimensions tab of the Analysis Button Properties dialog, you can select a dimension member based on the involved Analysis Button.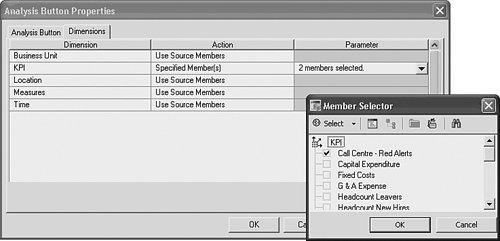 Table 19.6 describes the various properties, functions, and uses that can be set for Analysis Buttons.
Caution Unlike the Member Selector dialogs accessed through the Worksheet, Dimension Explorer, and Slice Navigator, the Member Selector dialog box accessed from the Specified Members option does not provide access to Favorites or Named Sets (a Microsoft SQL Server capability described earlier in this chapter). As such, be careful when re-creating these lists through this Member Selector to ensure that they reflect the member lists you are targeting. Tip Often, a report contains multiple Analysis Buttons all providing only slightly different functions to the end user. To facilitate Report Design, make sure to use the Copy and Paste functions accessible from the right-click menu on the Analysis Buttons. Using Text Box ObjectsThe Analytic Objects covered to this point have highlighted the powerful function that OLAP Intelligence provides on top of multidimensional (for example, OLAP) data sources. The last object available for use in Report Design is the text box and is exclusively focused on report formatting. Figure 19.44 shows a variation of the sample reports worked on in this chapter with some strategically placed text boxes added for aesthetic affect. Figure 19.44. Adding text objects to a KPI report can facilitate a clean presentation and end-user comprehension.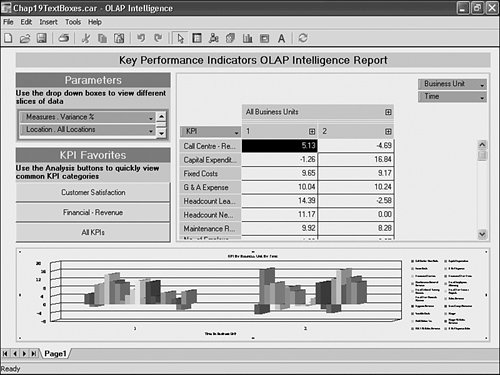 Standard formatting capabilities are provided through the Text Box properties dialog, which you can access by right-clicking on the involved text box. Creating Parameters with the Parameter ManagerSimilar to the Crystal Reports parameters discussed in Chapter 5, "Implementing Parameters for Dynamic Reporting," OLAP Intelligence also provides you with a rich parameter capability. These parameters enable you to re-use a single report/application across multiple user groups or users with different filtering requirements. OLAP Intelligence parameters can be set for the following:
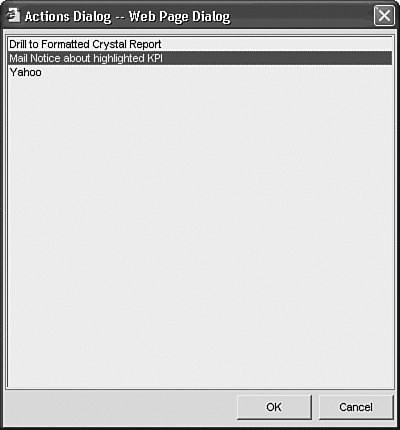
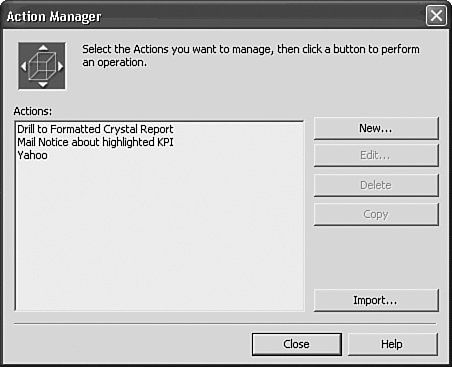
To add any of these parameters to a report, first use the Parameter Manager shown in Figure 19.45 to define the parameters. You can access this from the Tools menu. Figure 19.45. The OLAP Intelligence Parameter Manager enables you to add parameters to their OLAP Intelligence reports.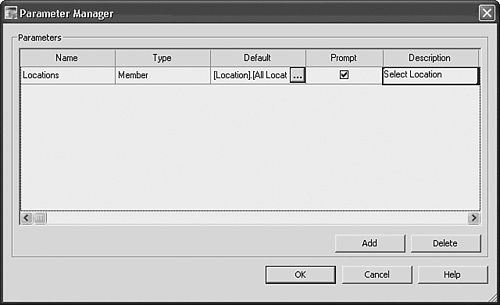 Each parameter is specified through five pieces of information in the Parameter Manager: a parameter name, the chosen parameter type (Cube, Member, Memberset, or Page), the default value for the parameter, a prompting toggle, and prompting text (description). All of these are rather intuitive except for the prompting toggle that is used to specify that end users should be prompted for the report when they view it through BusinessObjects Enterprise. If this is turned off, users will not be prompted for a parameter and the last saved value for that value in the report will be used. The second step to using parameters in an OLAP Intelligence report is to configure any dimensions that are to use the incoming parameters (Members or Memberset parameters only) as filters for their associated member selection. You specify this in the Member Selector for the involved dimensions. Figure 19.46 shows this selection for the Location Dimension on the sample report from this chapter. The parameters that have been created previously are found and selected under the Special Members node. Figure 19.46. Existing parameters can be specified as active filters in the Dimension Member Selector of the involved dimensions. Caution Be careful to test the parameters that you have implemented both in the OLAP Intelligence Design Environment and in the BusinessObjects Enterprise Web Delivery environment. Often, the product behavior can be somewhat surprising when you use prompting. After a parameter has been configured, you make it active for end users by either locking the report in the designer or publishing to BusinessObjects Enterprise. Figure 19.47 displays a report that has been locked. Note the selection screen that has prompted the user for parameter input that is used for filtering the underlying OLAP Intelligence report. Figure 19.47. The Set Parameters dialog and Associated Member Selector dialog on a web-published OLAP Intelligence Report within BusinessObjects Enterprise or after locking a report within the OLAP Intelligence designer. Creating Actions with the Action ManagerOLAP Intelligence actions are a powerful recent feature addition to OLAP Intelligence. They enable an OLAP Intelligence designer to predefine named operations for report users accessed from four different areas: from dimension headings, from individual members of a dimension, from specific data cells, or from Analysis Buttons. Actions enable end users to kick off other web pages, link into other applications, initiate email to colleagues, and launch other applications such as Crystal Reports or other OLAP Intelligence reports. These links can be made with flexible context awareness of exactly where on the report they were kicked off from (that is, which product member the cursor was on when the action was kicked off). Note In previous versions of OLAP Intelligence, actions defined on a Microsoft SQL Server were supported in much the same way that these new OLAP Intelligence actions are supported. In version XI and XI R2, both SQL Server actions and the new Custom OLAP Intelligence actions are supported and accessed in the exact same way. More information on SQL Server actions can be found in the documentation for Microsoft SQL Server Analysis Services. Actions are accessed in OLAP Intelligence by end users by either right-clicking any dimension, dimension member, or data cell, or by clicking an Analysis Button tied to an action, as described earlier in this chapter. If an action is available on the right-clicked report section, the Actions menu option is enabled and access to all defined actions is provided. A good example of an action could be based on a product dimension and be called Display Detailed Product Information. This might display a detailed Crystal Report based off some relational data from the product master tables and be nicely formatted for printing. An alternative example on the same dimension could be an Order Inventory action based on a product dimension's member. This action would link into the corporate procurement website and dynamically pass in the Product ID or Name. In both the OLAP Intelligence designer and the ActiveX Rich Client Web Viewer of BusinessObjects Enterprise, each action appears in the Actions submenu. In the Web (DHTML) client, the actions are displayed in a dialog. Figure 19.48 shows an action being called in the DHTML Web Viewer, using the KPI dimension of the sample KPI cube. Figure 19.48. Invoking an action from the DHTML worksheet in BusinessObjects Enterprise. Actions are created in the OLAP Intelligence Designer using the Action Manager accessible from the Tools menu. The Action Manager shown in Figure 19.49 enables you to add, delete, copy, edit, and import actions from other existing OLAP Intelligence reports. Figure 19.49 shows the New Action dialog and Table 19.7 describes the key components of an action. Figure 19.49. Creating a new action in OLAP Intelligence with the Action Manager, which you access from the Tools menu.
Note Remember that actions that apply to nothing cannot use any MDX or Crystal OLAP Syntax within their HTML or URL template. This means that these actions cannot take data context with them to their launched application. To pass in data-driven context at a report level, use the Applies to Cube option. As alluded to in the last entry of Table 19.7, you can use an asterisk to make an expression context-aware. The use of the asterisk and context depend on where the action was launched. The most common usage of the context asterisk is on Member and Data Cell actions. For actions launched from a Member, the context asterisk holds the place of the Member from which the action was launched. For example, with MDX, *.Name returns the name of the Member from which the action was launched. With Crystal OLAP Syntax, the expression would look like this: GetName({*}). For actions launched from a data cell, the context asterisk specifies the column or row member to which the data cell belongs to. Each cell belongs to multiple dimensions, so you must specify the dimension you want. For example, with MDX, [KPI].*.Name returns the name of the member in the Products dimension that corresponds to the cell from which the action was launched. With Crystal OLAP syntax, the expression would look like this: GetName({KPI@*}). Finally, the HTML example in Listing 19.1 shows how to specify the column, row, and sliced dimension members corresponding to a specific data cell. Listing 19.1. HTML Code Highlighting Context Placeholders for All Dimensions
The calling interface and the results of this action, known as Display Data Cell Context in the samples, are displayed in Figure 19.50. Figure 19.50. Calling a Data Cell action and the resulting HMTL page showing the context of the selected cell. This context could be used to drive external applications or link into drill-down Crystal Reports.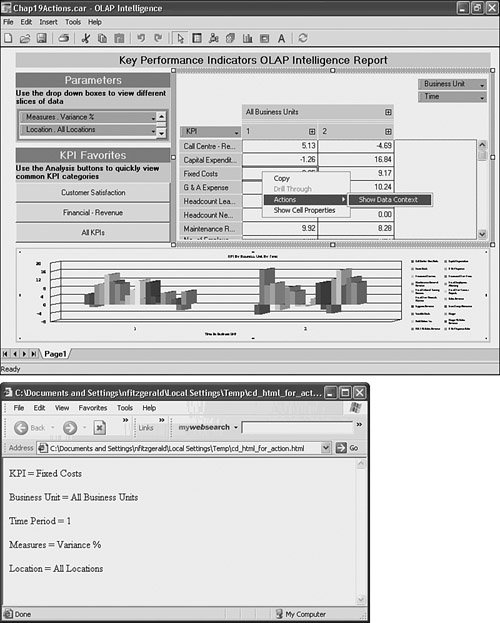 Although the Edit, Delete, and Copy commands in the Action Manager are quite intuitive, the Import Action option is a little more novel. The Import capability enables you to copy actions from any other OLAP Intelligence report maintained in the BusinessObjects Enterprise system. To complete an import, log on to BusinessObjects Enterprise and navigate to the desired OLAP Intelligence Report. On selection of the report, you are prompted to select one or more of the actions that exist in that report to import. The imported actions now become part of the current report. |
 For more information on Crystal Reports parameters,
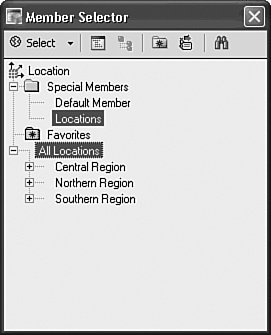

EAN: 2147483647
Pages: 365