Flylib.com

Books Software


Benefits of Cross-Tabs


Benefits of Cross-Tabs

Cross-tabs deliver data in a familiar spreadsheet format. They also summarize both vertically and horizontally, have a grid format, and can change size depending on the data.

Several of the most compelling reasons for using cross-tabs are

  • Making better use of space

  • Leveraging experience with the spreadsheet format

  • Horizontal expansion

  • Custom formatting

Because cross-tabs are grouped and summarized both vertically and horizontally, they are incredibly efficient at saving space as compared to a typical grouping report. They are very good at showing key information if the information required has at least two levels of grouping.

Here's an example: quarterly sales figures for the customers in a sales report. These need to be grouped by customer and quarter. If the report were shown in a standard grouping layout like you've worked with previously, it could be several pages long. Figure 10.1 shows a typical Crystal Report in which nine pages display only the USA customers grouped by customer and quarter.

Figure 10.1. Standard grouping style used on a typical sales report.


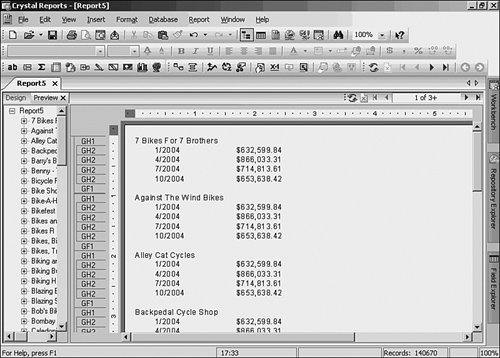
Cross-tabs replicate the information contained in a sales report while resembling a spreadsheet. Managers get a one-stop view of all the customers and their quarterly sales. Figure 10.2 shows how the information is more efficiently presented when a cross-tab is used to display the same information. Now the manager can view all the sales information at a glance.

Figure 10.2. Sales shown in a cross-tab.


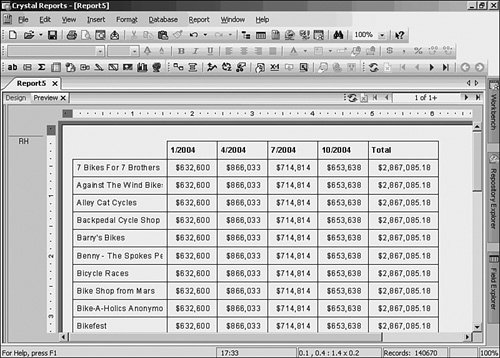
Leveraging Experience with the Spreadsheet Format

Another benefit of the cross-tab format is its familiarity to many users of spreadsheet applications. Many people use spreadsheets in their daily routines and are accustomed to their look and feel. Because cross-tabs do appear very much like spreadsheets, Crystal Reports offers a familiar format and reporting style for many users. Again, providing the information in the format most comfortable to the user improves his productivity and your success.

Horizontal Expansion

Cross-tabs, like spreadsheets, expand both vertically and horizontally. In Crystal Reports, cross-tabs are one of only two object types that expand across horizontal pages. Crystal Reports handles this expansion automatically. If there is more data to display than the original size of the cross-tab allows for, Crystal Reports doesn't cut off any critical data from the cross-tab area.

Custom Formatting

Cross-tab objects are also highly customizable in terms of formatting. Everyone has different needs from their data, so Crystal Reports allows for a great deal of changes to the formatting of these objects. Some of the most highly useful formatting features that are used in cross-tabs are

  • Customizable styles (colors, grid lines, and so on)

  • Vertical and horizontal placement of summaries

  • Formatted grid lines

  • Toggle for summary totals (rows/ columns )

  • Cell margins

  • Indented row labels

  • Location of totals (beginning or end for both rows/columns)

  • Repeatable row labels


Using the Cross-Tab Wizard

Start with an example for the Xtreme Mountain Bike Companythe fictitious company that corresponds to the sample database provided with Crystal Reports.

Xtreme management needs a summary report to provide a quick glance at its shipped orders. The managers want to know how much has been spent by country for every six-month period, but they only want to see the top 10 countries . Follow these steps to create this report:

1.

Create a new report by choosing File, New and when the Report Gallery appears, choose As a Blank Report and then click OK.

2.

The Database Expert appears. In the Available Data Sources list, expand the following nodes: Create New Connection, ODBC. Select the Extreme Sample database 11, click Next, and then click Finish.

3.

Expand Tables, and double-click on Customer and Orders. Click OK.

4.

The Database Expert dialog appears again. Click OK again to accept the default linking and click Finish to go to the report.

5.

Insert a cross-tab by choosing Cross-Tab from the Insert menu, or click the Insert Cross-Tab button on the Insert toolbar (the fourth item from the left). This will present you with a shadowed box attached to your cursor. Place the box in any Header or Footer of your report (not on a page header or footer) and in this case put it in the upper-left corner of the Report Header. The box will become an empty cross-tab.

6.

Set up the initial cross-tab. Right-click on the empty cross-tab and choose Cross-Tab Expert. The rows of the report are the countries, so select Country from the Available Fields and then click the arrow button (>) under Rows. The column grouping is going to be by Order Date, so choose Order Date from Available Fields and then click the arrow button (>) under Columns. Because the Order Date is supposed to be by quarter, click on the Group Options drop-down under Columns and change the third list box from Each Day to For Each Quarter. Finally, choose Order Amount from Available Fields and click the arrow button (>) under Summarized Fields so that the cell 's summary is also selected. The final result looks like Figure 10.3.

Figure 10.3. Cross-Tab ExpertCross-Tab tab.


7.

Click the OK button to close the Cross-Tab Expert and see the result in the report Preview, as shown in Figure 10.4.

Figure 10.4. Cross-tab in Preview.


8.

Before continuing, save your work. Choose File, Save As. Call this cross-tab1.rpt and then click OK.