Generating Sales Reports
| Besides generating site statistics, you can also generate sales statistics. Want to view how many orders were generated for each product? How much revenue was produced from that product? How much revenue was generated yesterday, last week, last month, or even in the last 365 days? You can even compare a certain month to the same month last year. Merchant Solutions also has tools to present your data in a graph format. Let's take a look at a few sample sales reports. Monthly Store Activity ReportAs seen in Figure 14.14, this report gives you a quick glance of monthly sales statistics. The report is displayed in a table format by month. Although the default report is by month, you can also switch to weekly and daily view. For each month, you can view the following:
The Monthly Store Activity Report is a great way to quickly glance at how well your site is performing. Figure 14.14. The Monthly Store Activity Report can give you a quick glance of sales statistics. This is a great tool to view sales data over a period of time. To view the Monthly Store Activity Report
Sales by Product ReportYou can view sales statistics for every item in your store, as seen in Figure 14.15. The sales report will list all your items ranked by the number of orders. It will also display the total amount generated for each item. This is a great tool to show how well your items are selling. If an item falls below expectations, you may want to consider repositioning the item onto a page with a higher page view. Figure 14.15. The Sales by Product Report will display all the products available in your store and the revenue generated for each product. The report is ranked by the number of products sold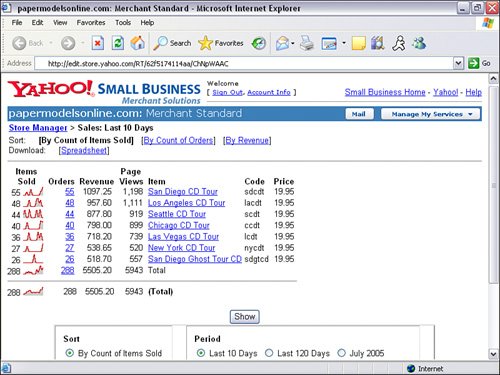 To view the Sales by Product Report
Managing your workflow will keep your business running smoothly and keep your customers satisfied. In this chapter we discussed how to process orders, manage your inventory, and prevent losing revenue to fraudulent orders. In the next chapter, we'll discuss customer service and tips to avoid getting bad reviews or returned products. We'll also discuss how Yahoo! can be your help desk. |
EAN: 2147483647
Pages: 149