Using Yahoo Site Stats Resources
Using Yahoo! Site Stats ResourcesStore Editor and Web Hosting statistics are completely different, and each has its own data set. You need to view the appropriate statistics for the method you are using to create your pages. If you are using a combination of both Store Editor and Web Hosting, you need to mine both sets of stats. Both stats packages are Web based, so you can view your stats with just your browser. The advantage of using the Web Hosting side is that you can download the raw log files for use with a third-party analysis tool, for more advance statistical reporting or have it automated. You can also use a workaround for advanced statistical reporting by using a third-party online stats tool if you are using Store Editor (discussed later). Web Hosting has its own statistics section, called Site Statistics, under the Hosting Control Panel (see Figure 17.1). Site Statistics pulls information from log files that track traffic only to your Web Hosting account. If you do not use Web Hosting, you will not see any statistics. These statistics do not apply to traffic from the Store Editor or Catalog Manager products. With Web Hosting, you can download raw log files to use with your own Web statistics software, such as WebLog Expert (www.weblogexpert.com) (see Figure 17.2), WebTrends (www.webtrends.com), and LiveSTATS by DeepMetrix (www.deepmetrix.com). Figure 17.1. You can view Web Hosting statistics in the Web Hosting Control Panel.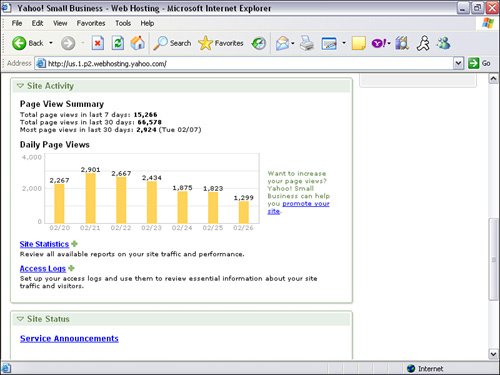 Figure 17.2. WebLog Expert is a great third-party tool for analyzing your access log.
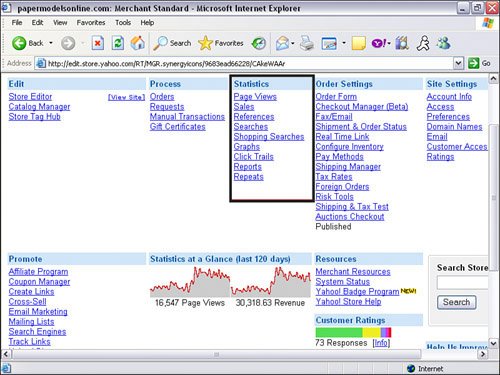
In contrast, the statistics maintained in Store Manger under the Statistics column apply only to traffic on the Store Editor Web pages and sales of products in Catalog Manager. When a visitor goes to a Store Editor page, the stats gets recorded in at least three places in Store Manager's Statistics section: Reports, Page Views, and Click Trails. When a visitor makes a purchase, the sale is recorded in at least two places in Store Manager's Statistics section: Sales and Reports. Viewing Web Hosting Site StatisticsSite statistics provide basic Web statistics supplied by Yahoo!, including these (see Figure 17.3):
Figure 17.3. Site Statistics is Yahoo!'s built-in statistics program for Web Hosting.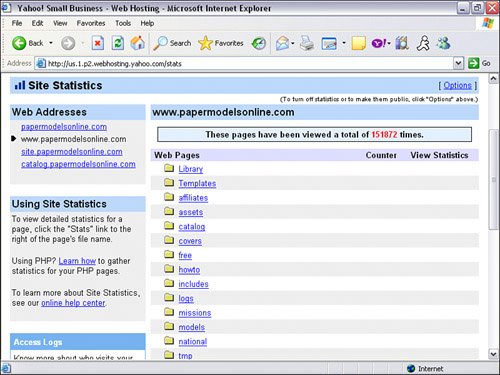 To view Web Hosting statistics, follow these steps:
Configuring and Downloading Access Log FilesDownloading access log files and analyzing them with a more robust statistics-analyzer program, such as WebLog Expert, can give you more in-depth detail on how your site is performing. Before you can start downloading log files, you need to turn them on. As a default, the Yahoo! store has access log files turned off. You must turn them on and configure access log setup. You can select how many recent logs you want to keep; whether you want to roll access logs daily, weekly, or monthly; and which time zone you are in. To configure access log files, follow these steps:
Warning You can keep only up to 28 log files. Therefore, make sure you download the files before the system overwrites the old files with the new ones. To download access log files, follow these steps:
Viewing Store Editor StatisticsIf you are using the Store Editor and Catalog Manager, you can view your statistics in Store Manger. To view Store Editor statistics, follow these steps:
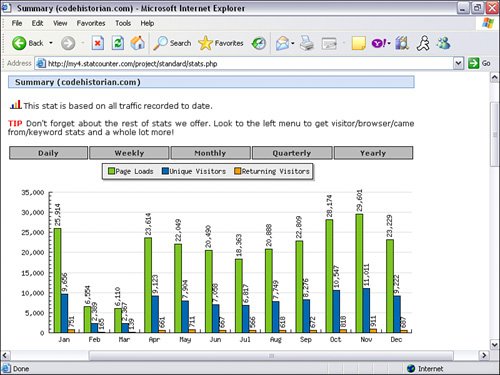
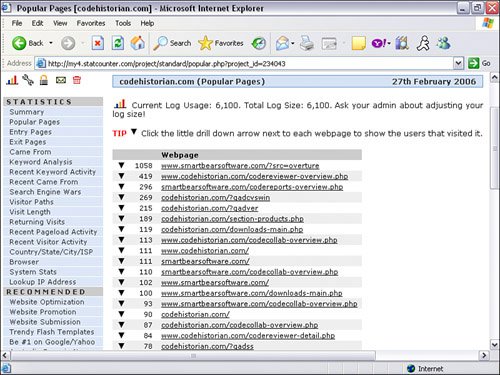
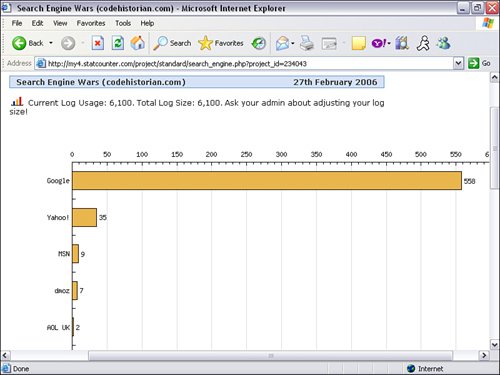
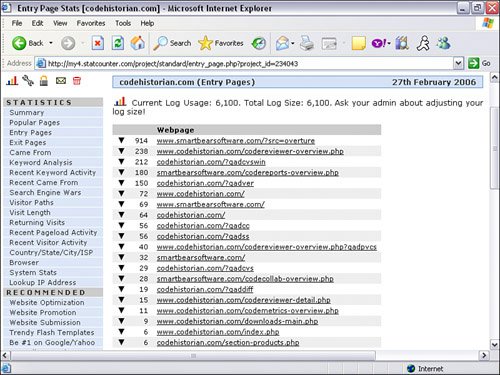
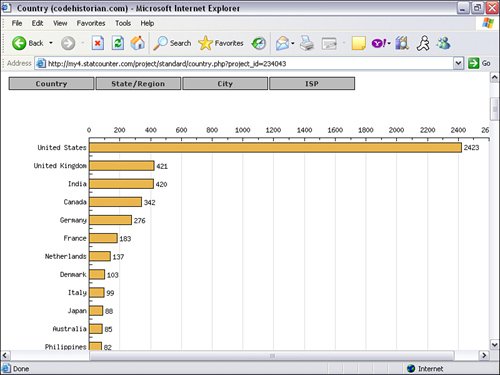
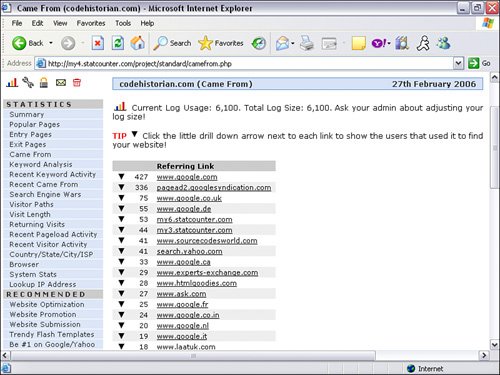
If you are using Store Editor, you will not be able to download access log files for more detailed statistics. Although you can get basic statistics, we recommend using a third-party online stats solution. This is a great workaround for users of Store Editor. Using Third-Party Online Service for Detailed Statistics (Workaround for Store Editor Users)Store Editor users can get more in-depth statistical reporting by using a third-party online stats service. This is a workaround because there are no access log files for you to download and analyze when using Store Editor. Instead of having your statistics sent to Yahoo!'s access log files, as with Web Hosting, your store statistics are sent to the third-party online stats server access logs. When you sign up for an account, you simply add a piece of code to your RTML template. Every time someone visits a Web page, the Web tracker code sends important information to your third-party online Web stats log. The system automatically generates charts, graphs, and statistics to make analyzing your traffic easier. The difference with this online stats service is that you do not need to install software on your machine or be restricted to using just Yahoo!'s stats reports; the Web-analysis software is installed on their server. However, you might need to consult with an RTML programmer to add the code to your RTML template. Statscounter (www.statscounter.com) and Google Analytics (www.google.com/analytics/) are two free online stats counter services you can use. You can sign up for an account on their websites. Google Analytics (see Figure 17.5) and Statscounter (see Figure 17.6) both provide more detailed statistics than the built-in Yahoo! stats. Figure 17.5. Google Analytics is a free online stats service provided by Google.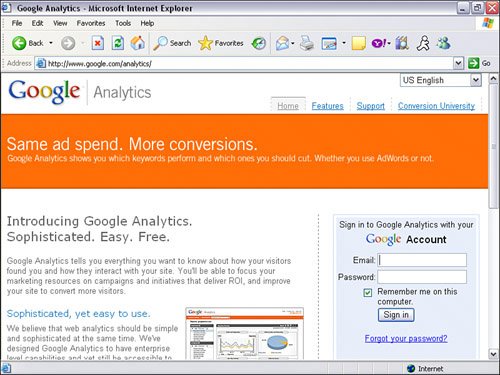 Figure 17.6. Statscounter is a free online stats service. You can install an invisible counter on each of your Web pages.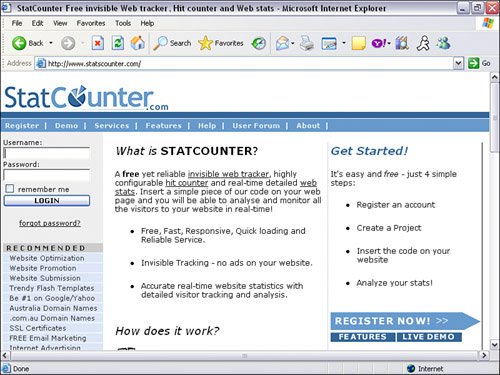 Let's deconstruct an example of a server analysis report to understand what makes them tick. Deconstructing a Statscounter ReportHere are some of the statistics you can view with Statscounter reports:
Let's take a look at some of the statistics provided and discuss why they are important to analyze:
These are some of the report statistics you will use the most. Make sure you explore all the specific reports to see if the information holds any value for you. Your Web server reports and the statistics they provide are a valuable tool to fine-tune your marketing program and give you a window into what is happening at your Yahoo! store. In the next chapter, we cover the lost stepchild of marketingpublic relationsand how you can use it to market your Yahoo! store. |
EAN: 2147483647
Pages: 208